
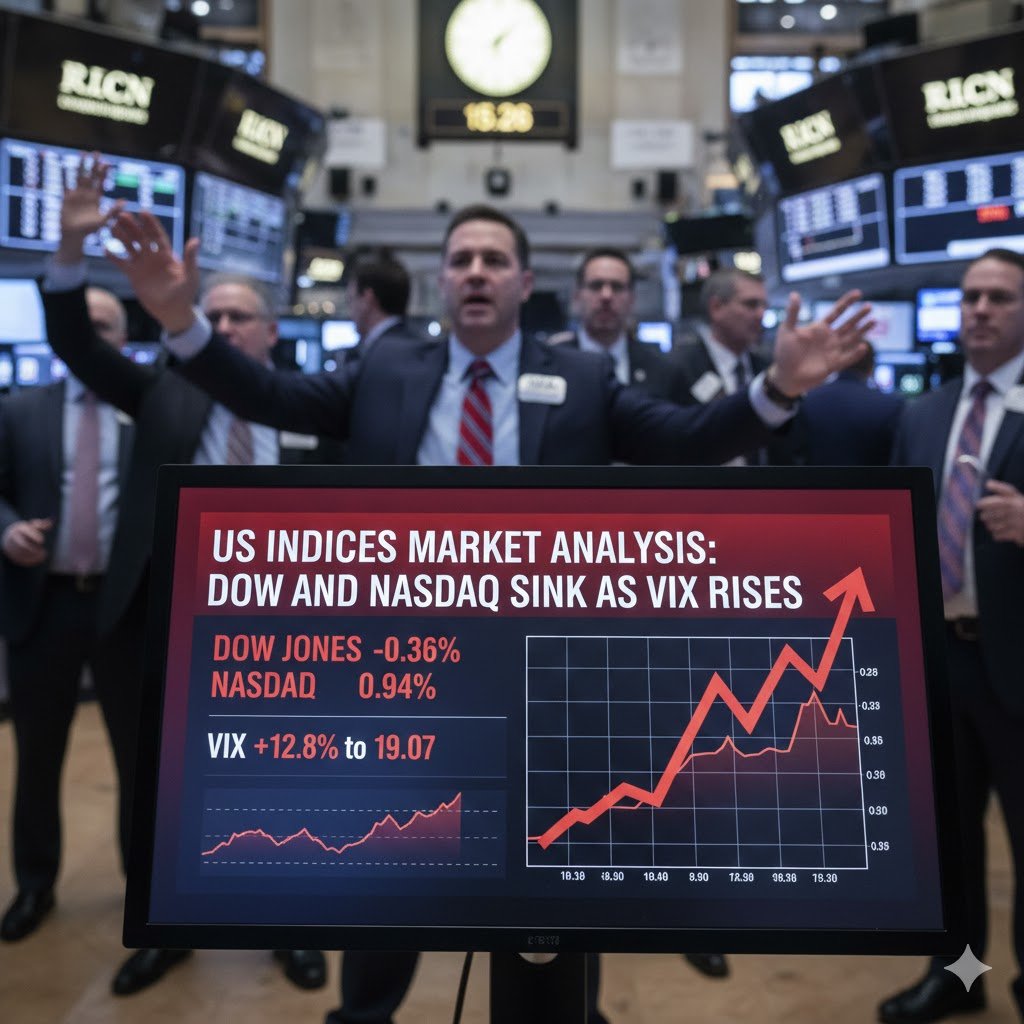
The opening bell on Wall Street for February 2, 2026, has brought a wave of selling pressure across all major benchmarks. This US indices market analysis examines the current technical breakdown as the Dow Jones Industrial Average, S&P 500, and Nasdaq Composite all track lower in early trading. The sentiment is undeniably cautious, with the CBOE Volatility Index (VIX) surging over 12% to touch the 19.07 level, signaling heightened investor anxiety.
Dow Jones and S&P 500: Testing Key Psychological Levels
As of the first hour of trading, the Dow Jones Industrial Average is down roughly 179 points, trading at 48,892. This represents a 0.36% decline, following a sluggish close to January. Our US indices market analysis shows that the Dow is currently struggling to maintain its footing above the 48,500 support zone. A failure to hold this level could trigger a deeper correction toward the 47,000 range, which served as a consolidation base late last year.
The S&P 500 is showing similar weakness, slipping 0.43% to trade at 6,939. The index is experiencing a “spillover” effect from the dramatic deleveraging seen in the precious metals markets. As traders face margin calls on their gold and silver positions, they are forced to liquidate blue-chip equities to cover their requirements, creating a cascading effect across the broader market.
Nasdaq and Tech Sector: The AI Bubble Concerns
The Nasdaq Composite is once again the underperformer, shedding 0.94% to sit at 23,461. According to our US indices market analysis, the tech sector is facing a dual threat: rising yields and cooling sentiment regarding AI investments. Recent comments from industry leaders about the massive capital expenditures required for artificial intelligence have led investors to question when these investments will begin to yield significant returns.
Major tech players like NVIDIA and Amazon are trading in the red, weighing heavily on the index. From a technical perspective, the Nasdaq is testing the lower boundary of its ascending channel. A sustained break below 23,000 would be a major bearish signal, potentially ending the bullish run that defined much of 2025.
The VIX Spike: Understanding the “Fear Gauge”
One of the most telling signs in today’s US indices market analysis is the move in the VIX. Starting the day around 16.88, the index has spiked to 19.07, a jump of nearly 13%. Historically, when the VIX crosses the 20 mark, it signals a transition from “orderly selling” to “heightened panic.” This volatility is being fueled by uncertainty surrounding the Federal Reserve’s future path under the potential leadership of Kevin Warsh, whose hawkish reputation is rattling the bond markets.
The inverse relationship between the VIX and the S&P 500 is on full display today. As volatility rises, hedging costs increase, which often leads to further automated selling by risk-parity funds. Traders should keep a close eye on the 20.00 level for the VIX; a close above this could lead to a very “noisy” week for US equities.
Macro Drivers: Fed Nominations and Economic Data
The primary fundamental driver for today’s price action is the political and monetary landscape in Washington. The market is currently reassessing its inflation expectations following hotter-than-expected wholesale inflation data from last week. This, combined with the “Warsh Shock,” suggests that the Fed may be less inclined to cut rates in the first half of 2026 than previously hoped.
Furthermore, the easing of geopolitical tensions in the Middle East, while positive for oil prices, has removed a “safe haven” bid that previously supported some sectors of the market. This US indices market analysis suggests that we are entering a phase where “good news is bad news” as the market fears a resurgent economy will keep interest rates elevated for longer.
Conclusion: Strategic Outlook for US Traders
To summarize, the US markets are currently in a defensive posture. The combination of tech sector exhaustion, a spike in volatility, and shifting Fed expectations has created a perfect storm for a short-term pullback. Investors should look for signs of stabilization around the 48,500 level for the Dow and 6,900 for the S&P 500.
For those looking for opportunities, defensive sectors like utilities and healthcare may provide some shelter, while high-growth tech remains at risk. Stay disciplined, monitor the VIX closely, and ensure your stop-losses are positioned to handle the increased intraday swings that are likely to persist throughout the week.

Written by T. S. Gospodinov
T. S. Gospodinov is an Independent gold market analyst focused on liquidity structures and macro-driven price cycles.


