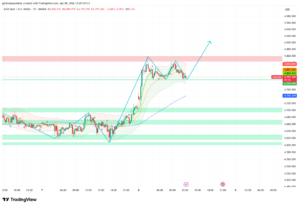
Following the massive breakout on the 4-hour timeframe, the 1-hour chart provides a surgical view of market participation. As Gold stabilizes near $5,075, identifying the next “Liquidity Pool” is essential for intraday execution.
Immediate Support and Demand Zones
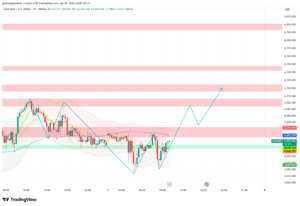
The 1H chart reveals a strong demand zone formed just below the current price. We see a cluster of orders between $5,020 and $5,040. If the market attempts a “Mean Reversion” move, this is the area where institutional buyers are likely to defend their positions to prevent a drop back below the $5,000 handle.
Liquidity Grabs and Stop Runs
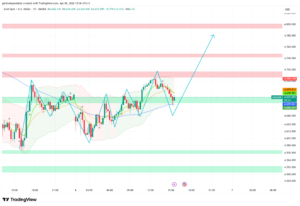
Currently, there is a significant amount of buy-stop liquidity sitting above the recent high of $5,085. A push above this level could trigger a “Short Squeeze,” catapulting Gold toward the next psychological resistance at $5,100. Conversely, sell-side liquidity is building below the $5,000 mark, which remains the ultimate “Line in the Sand” for bulls.
Trading the Consolidation
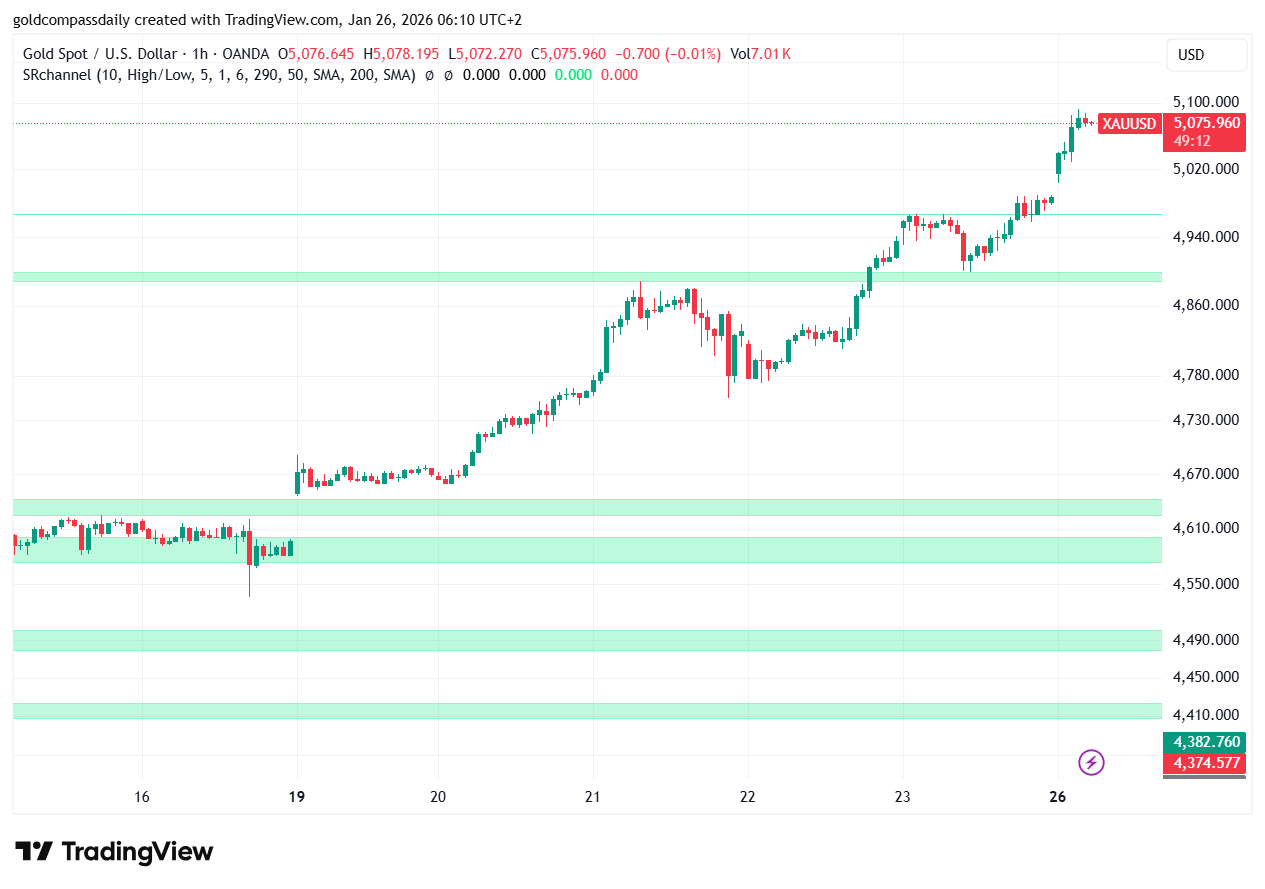
The tight price action on the 1-hour timeframe suggests that the market is catching its breath. In the Gold Compass Terminal, we categorize this as a “High-Value Consolidation.” Traders should avoid over-leveraging in the middle of this range and wait for a clear sweep of either the $5,085 high or the $5,050 minor support.
Liquidity Insight: Watch the volume profile on the 1H chart. A decrease in volume during this consolidation often precedes a massive directional expansion.

Written by T. S. Gospodinov
T. S. Gospodinov is an Independent gold market analyst focused on liquidity structures and macro-driven price cycles.