
Following a robust recovery from early February lows, Gold (XAU/USD) has entered a pivotal consolidation phase as of February 17, 2026. Market structure currently suggests a high-probability “buy-the-dip” scenario, where a minor technical correction is expected to find support at key Fibonacci retracement levels before the primary bullish trend resumes its trajectory toward $5,140.
The Fibonacci Lens: Identifying the Correction Floor
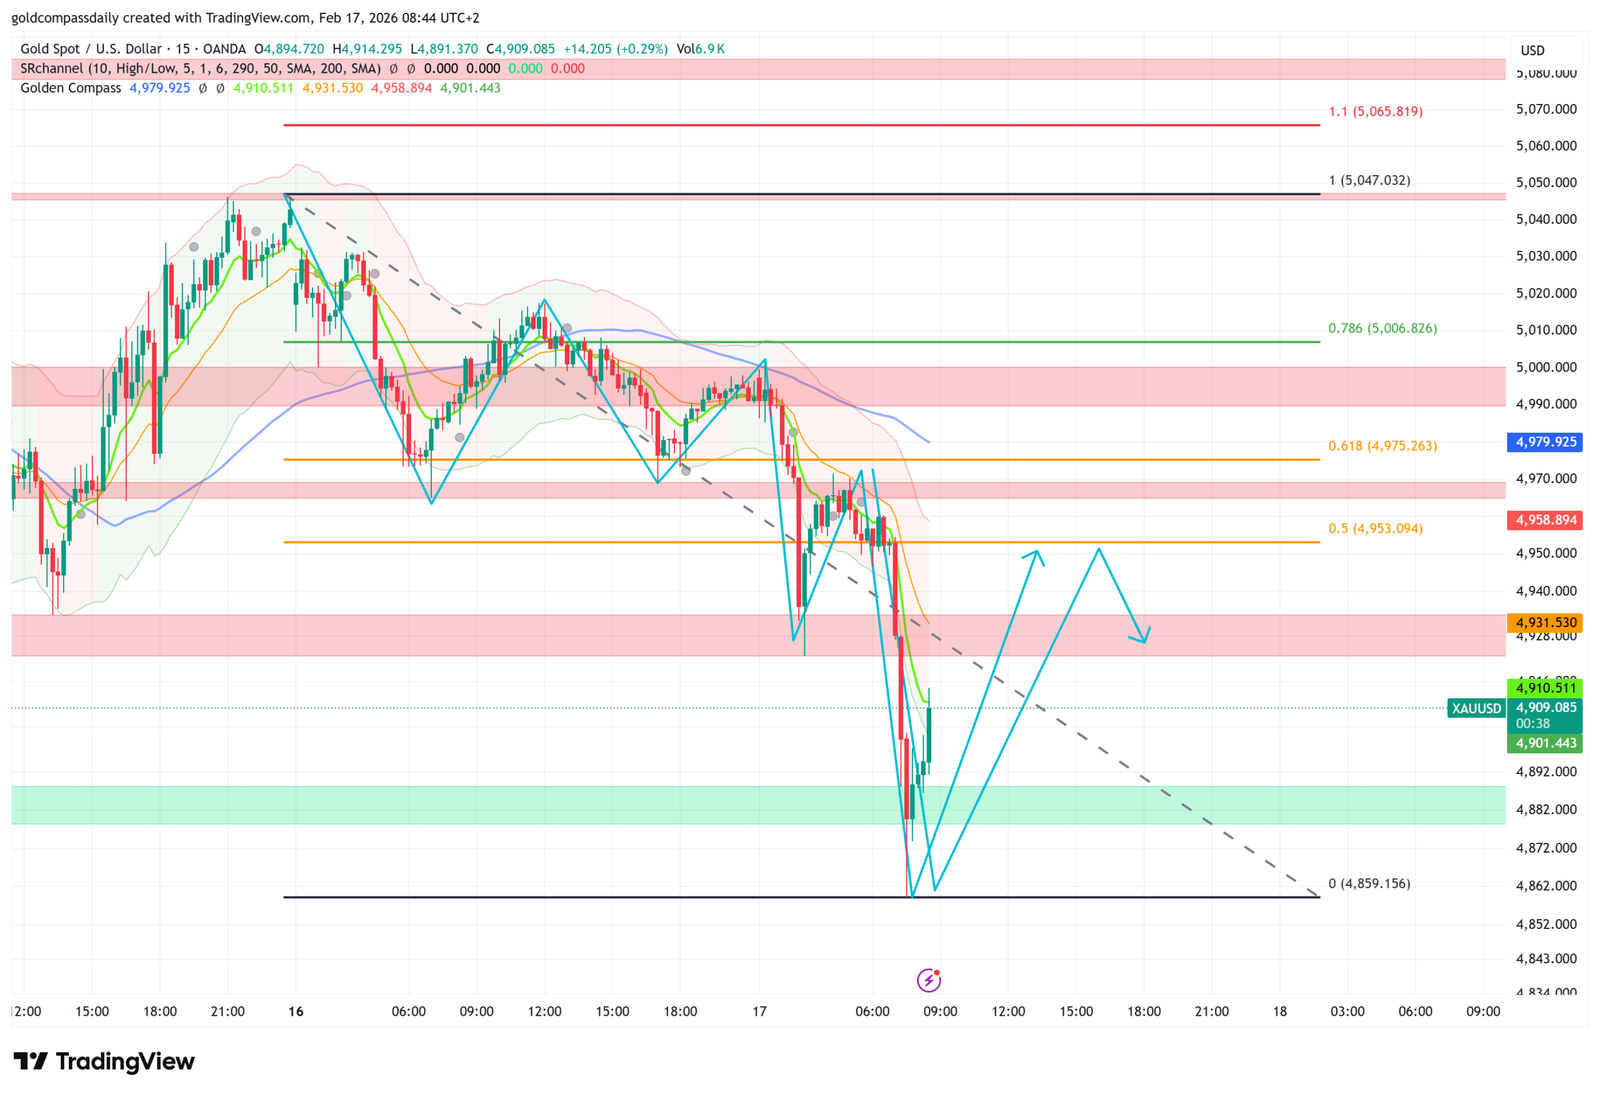
The recent impulsive leg from the $4,400 monthly low to the $5,120 local peak has established a new range for Fibonacci analysis. Traders are closely monitoring the $4,940 – $4,960 zone, which aligns with the 23.6% and 38.2% retracement levels. Stability in this area would confirm that the current pullback is merely a corrective pause within a larger redistribution phase.
- Primary Support ($4,937 – $4,946): This zone represents a confluence of the 23.6% Fibonacci level and the 50-period EMA, making it a critical area for bulls to defend.
- Deep Correction Threshold ($4,820): A failure to hold the $4,940 handle could expose the 50% retracement level near $4,820, where larger institutional buyers are expected to re-emerge.
Upside Expansion: Targets Beyond the Pullback
As long as the price action respects the established trendline support, the “Green Path” remains the dominant outlook. A successful bounce from the Fibonacci clusters would likely lead to a retest of the psychological $5,000 level, followed by an expansion toward major resistance.
- Immediate Resistance: The $5,095 – $5,142 supply zone remains the primary hurdle for a trend continuation.
- Secondary Extension: A decisive breakout above $5,142 would activate Fibonacci extension targets at $5,266 and potentially the 76.4% retracement level at $5,315.
Technical Indicator Matrix
| Indicator Type | Key Level / Value | Market Signal |
|---|---|---|
| Fibonacci Pivot Point | $4,964.40 | Equilibrium Zone |
| Relative Strength (RSI 14) | 40.55 | Neutral/Bearish Pressure |
| 50-Period EMA (4H) | $4,942.00 | Dynamic Support |
| Trendline Support | $4,811.00 | Critical Floor |
Disclaimer: This technical analysis is for informational purposes only. Trading XAU/USD on margin involves substantial risk. Market conditions can shift rapidly ahead of high-impact events like the FOMC minutes release later this week.

Written by T. S. Gospodinov
T. S. Gospodinov is an Independent gold market analyst focused on liquidity structures and macro-driven price cycles.


