
Gold is finding its footing at the start of what promises to be a pivotal week. After touching a session low of $4,488 in the early Monday session — the lowest level since late April — XAU/USD has recovered to $4,537 as buyers stepped in at a level that has held structurally throughout the post-Liberation Day recovery. The 15-minute chart projects one more dip to the $4,521.541 support zone before a recovery toward $4,660+. Today’s calendar is the lightest of the week — Canada is on bank holiday, and the major data events that will define gold’s direction land on Wednesday (FOMC Minutes, UK CPI) and Thursday (Flash PMIs, Claims). But the China data published overnight has delivered a comprehensive set of misses that establish the global growth backdrop for everything that follows.
This is the Monday session analysis for the week of May 18–23. For the full weekly event guide — including FOMC Minutes on Wednesday, Flash PMIs on Thursday, UK and Canadian CPI, and the complete data calendar — see the Gold Week Ahead: May 18–23 outlook.
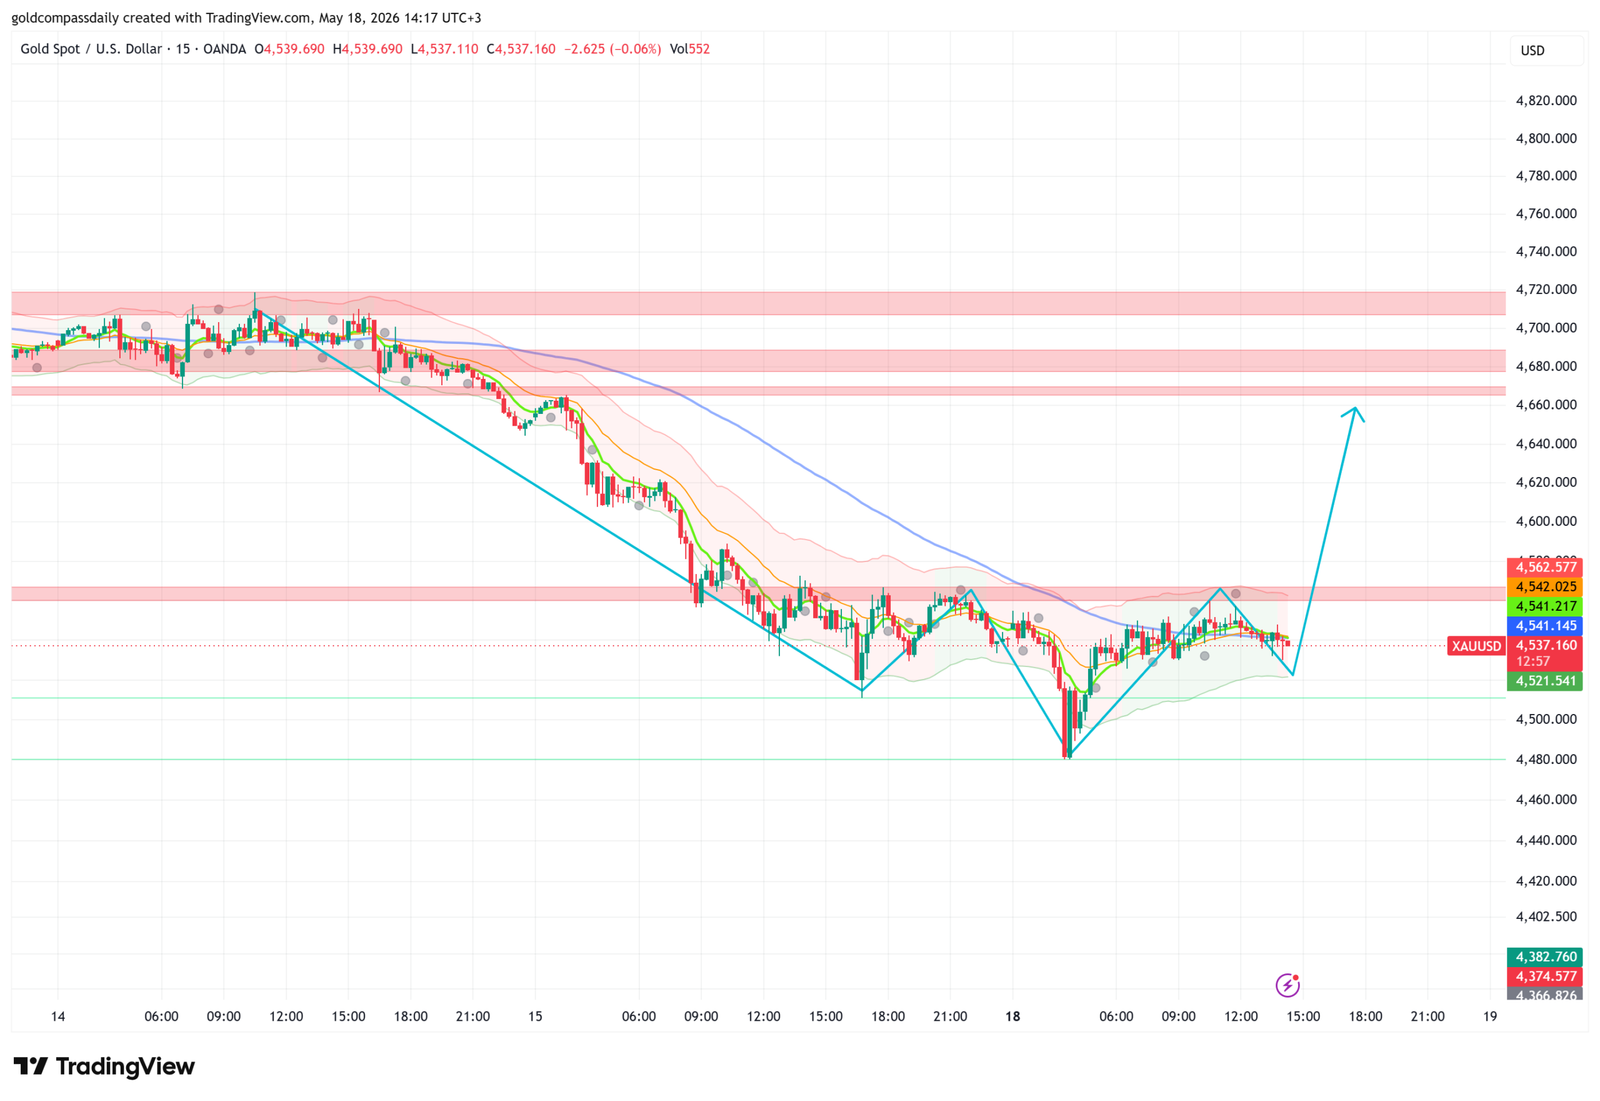
The Chart: $4,488 Low Holds, One More Dip Before the Recovery
The 15-minute chart shows a classic demand absorption pattern. The drop from $4,700+ last week to Monday’s $4,488 low has been sharp and sustained — five consecutive sessions of selling pressure. But the $4,488 level is not arbitrary: it aligns with the grey demand zone visible on the 4-hour chart, and the speed of the recovery from that low (from $4,488 back to $4,537 within a few hours) confirms that buyers were waiting at that level rather than absent from it.
The projected path on the 15-minute chart shows one more dip into the $4,521.541 support area — a normal corrective retest of the low — before the recovery begins in earnest. The targets above are sequential: $4,541.145 (immediate resistance), $4,542.025, $4,562.577 (first meaningful ceiling), then the pink resistance bands at $4,580–$4,590 and beyond toward $4,660+ as the week’s primary upside objective.
The floor is $4,488. A close below that level on a 15-minute basis would signal the demand zone has failed and would open the $4,382–$4,374 green support bands visible at the bottom of the chart. Above $4,562.577, the recovery has genuine momentum and the week’s targets come into view.
China Data: Comprehensive Misses Establish the Week’s Growth Narrative
The overnight China data release — covering April activity across the entire economy — delivered a sweep of misses that sets the global growth backdrop for the week’s events. This is the most important data context for gold entering Monday: a world where the largest emerging market economy is showing clear signs of tariff-driven deceleration.
China Fixed Asset Investment ytd/y at -1.6% — against a forecast of 1.7% and a prior of 1.7%. A dramatic reversal. Chinese businesses invested 1.6% less than a year ago on a year-to-date basis — the first negative fixed asset investment reading in recent memory. This signals that the tariff uncertainty from Liberation Day is now affecting Chinese corporate capital expenditure decisions directly. Companies are not building new capacity when they cannot predict export demand.
China Industrial Production y/y at 4.1% — below the forecast of 6.0% and the prior 5.7%. Factory output grew at less than half the expected pace. The gap between forecast (6.0%) and actual (4.1%) is one of the largest monthly misses in Chinese industrial data this year. Export orders, disrupted by US tariffs, are flowing through to reduced production schedules.
China Retail Sales y/y at 0.2% — dramatically below the forecast of 2.0% and the prior 1.7%. Chinese consumers are not spending. A 0.2% annual growth rate in retail sales — essentially flat — signals that the confidence effects of the Liberation Day shock are now feeding into domestic consumption behaviour. This is the same pattern visible in UK, US, and Japanese consumer data: tariff uncertainty depresses sentiment, which depresses spending, before the actual inflation hit arrives.
China Unemployment Rate at 5.2% — slightly better than the forecast of 5.3% and improving from the prior 5.4%. The one positive from the overnight data: the Chinese labour market is holding up better than the other activity indicators would suggest. Employment resilience typically precedes consumer spending recovery — if the labour market holds, the retail miss may prove temporary.
For gold, the China data is unambiguously supportive through two channels. First, the global growth slowdown narrative intensifies — when the world’s second-largest economy shows simultaneous misses on investment, industrial output, and consumer spending, the case for central bank easing globally strengthens. Second, the tariff transmission mechanism is confirmed in hard data — what was projected in March is now measurable in April Chinese statistics. The Fed, ECB, and BOE all face the same question this week: how do you respond to tariff-driven inflation while growth is decelerating?
BusinessNZ Services: New Zealand Contraction Deepens
New Zealand’s BusinessNZ Services Index printed at 48.9 — below the 50 expansion threshold for the second consecutive month, compared to the prior 46.2 which was even weaker. The reading of 48.9 represents a slight improvement from the prior contraction but confirms that New Zealand’s services sector has not recovered. This is consistent with the global services PMI trend: outside of the US, services activity is contracting or barely growing across most of the Asia-Pacific region. NZD faces continued pressure.
UK Housing: Rightmove Beat
Rightmove HPI m/m at 1.2% — above the prior of 0.8%. UK asking prices on Rightmove rose more than last month — a positive signal for the housing market that stands in some contrast to the Halifax HPI miss last week (-0.1%). The divergence between survey asking prices (rising) and transaction prices (falling) is typical of a market in transition: sellers are still pricing optimistically, but completed transactions are printing below those levels. For GBP, the Rightmove beat is mildly positive — it adds one data point to the case that UK housing is stabilising rather than deteriorating.
China New Home Prices: Still Falling, But Slower
China New Home Prices m/m at -0.19% — a slight improvement from the prior -0.21%. Chinese property prices are still declining, but the pace of decline is slowing marginally. This is the eighth consecutive monthly decline but the rate of deterioration is the lowest in this sequence — a tentative sign of stabilisation in China’s property sector, which has been a major source of financial stress for the past two years. For gold, a stabilising Chinese property market reduces one of the risk channels for Chinese financial system stress but also reduces emergency PBoC easing expectations.
Italian Trade Balance: Deteriorating
Italian Trade Balance at 4.71B — below the forecast of 5.25B and the prior 4.98B. Italy’s trade surplus is narrowing — fewer exports and/or more imports in March data. In the context of Liberation Day tariff disruption to European trade flows, a declining Italian surplus is consistent with the broader picture of European exporters losing competitiveness or facing reduced demand in US markets. EUR/USD is mildly pressured on this data.
MPC Members Greene and Mann: BOE’s Opening Communication
MPC Member Greene speaks at 10:35am and MPC Member Mann at 11:30am — two Bank of England communications on a day when there is limited competing data from the US or Europe. Both speakers will be assessed for any signals about the June BOE meeting — whether last week’s one-dissent hold is moving toward a two-dissent or majority-cut composition. Greene has been a centrist member; Mann has historically been more hawkish. If Mann signals any softening toward easing, it would be a significant dovish signal for GBP and would accelerate May/June cut pricing.
G7 Finance Ministers: Trade Policy Watch
G7 Meetings begin today (Day 1). Finance ministers from the US, UK, Germany, France, Italy, Japan, and Canada convene. The central agenda item is the global economic response to Liberation Day tariffs and whether G7 coordination can produce a framework for reducing trade tensions. Any joint statement that signals US willingness to negotiate tariff adjustments would be a significant risk-on event: dollar weakens, equities rally, gold’s safe-haven premium reduces temporarily. Any statement that formalises the tariff landscape as permanent would have the opposite effect. Watch for headlines throughout the day — G7 communiqués can move markets without warning.
5:00pm — NAHB Housing Market Index
NAHB Housing Market Index is forecast at 34 — unchanged from the prior 34. At 34, US homebuilder confidence is well below the neutral level of 50 and signals persistent pessimism about housing market conditions. A reading that holds at 34 is neutral — it confirms the status quo of a housing market under pressure from elevated mortgage rates without adding new information. A miss below 30 would be a genuine deterioration signal. A beat above 37 would be a positive surprise that adds to the US economic resilience narrative — mild dollar support, mild gold headwind.
11:00pm — TIC Long-Term Purchases: The Dollar Confidence Signal
TIC Long-Term Purchases at $82.4B (prior $58.6B) — an expected dramatic increase in foreign purchases of US long-term securities. A reading of $82.4B would represent a $23.8B increase from last month and would signal that foreign investors — central banks, sovereign wealth funds, institutions — are significantly increasing their holdings of US Treasuries and equities despite the trade policy uncertainty.
This is the most counterintuitive data point on today’s calendar. In a world where the US is imposing broad tariffs on its trading partners, you might expect foreign investors to reduce their exposure to US assets. A strong TIC reading would suggest the opposite — that dollar assets remain the world’s preferred safe-haven regardless of trade policy. That outcome would be dollar-positive and could create a modest gold headwind into Tuesday’s session.
A miss — particularly a reading below $40B — would be the most significant US data signal of the day: foreign investors pulling out of dollar assets is a structural dollar-weakening force and would support gold’s recovery from the $4,488 low.
Key Levels and Market Summary
- Gold (XAU/USD): $4,537 · Dip target $4,521 · Resistance $4,541 → $4,562 → $4,580–$4,590 · Target $4,660+ · Floor $4,488 · TIC data 11:00pm is today’s most important US release
- China data sweep: Industrial Production -1.9pp miss · Retail Sales -1.8pp miss · Fixed Asset Investment reversal to -1.6% · Global growth slowdown confirmed · Gold safe-haven demand supported
- EUR/USD: Italian trade balance miss · China data reduces global risk appetite · G7 headlines throughout day · MPC speakers shape GBP direction · Light European afternoon
- GBP/USD: Rightmove beat (1.2%) vs Halifax miss last week · Greene 10:35am + Mann 11:30am = two BOE signals · Mann hawkish shift = GBP support · Mann softening = GBP weakness
- AUD/USD: China misses = AUD headwind despite commodity currency status · No major AUD catalyst today · Follows risk sentiment
- USD/JPY: China growth concern = mild yen safe-haven support · TIC data at 11pm drives close · Strong TIC = dollar support = pair holds · Weak TIC = pair falls
- S&P 500 futures: China misses = global growth concern · G7 de-escalation headlines = upside risk · NAHB at 5:00pm = secondary input
- Gold week ahead: Today establishes the support at $4,488–$4,521. Wednesday’s FOMC Minutes and UK CPI are the week’s defining events. Thursday’s Flash PMIs and Claims complete the picture. Full weekly analysis: Gold Week Ahead May 18–23
Gold at $4,537 is not broken — it is consolidating at a structurally significant support level while the week’s major events queue up. The China misses confirm the global growth deceleration that is gold’s fundamental tailwind. The $4,488 low held. The recovery toward $4,521 and then $4,562 is the technical path. Wednesday’s FOMC Minutes and UK CPI are the catalysts that will determine whether the week closes above or below $4,635. Today’s job is simple: hold $4,488, absorb the TIC data at 11pm, and position for what comes next.
Analysis based on the XAU/USD 15-minute chart as of May 18, 2026, 14:17 UTC+3. Economic data sourced from the daily macro calendar. This article is for informational and educational purposes only and does not constitute financial advice.