
Gold holds the $4,529 demand zone as UK wages accelerate and Canadian inflation data approaches.
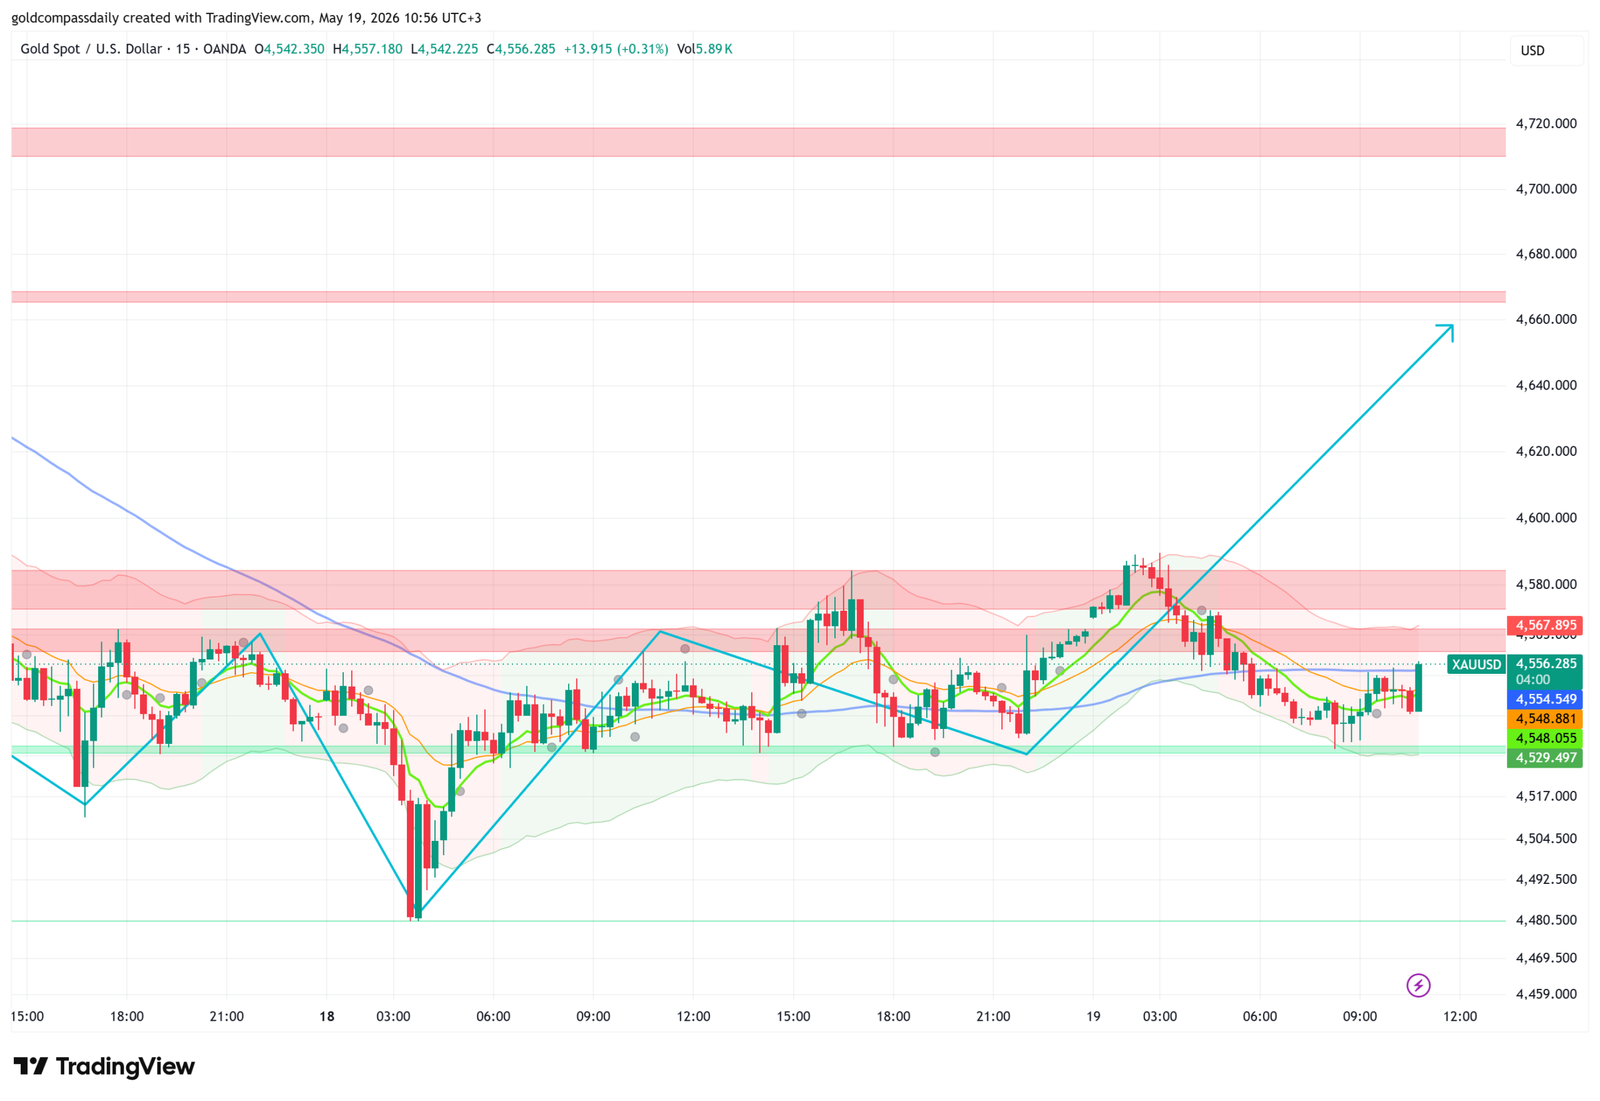
XAU/USD is trading at $4,556 — up from Monday’s $4,488 low — consolidating inside the green demand band as a string of morning data prints reinforces the stagflation narrative that has been gold’s structural driver since Liberation Day. The 15-minute chart projects a continuation toward $4,660+ without a significant corrective dip, supported by a technical structure that has shifted from bearish to neutral-bullish since the $4,488 floor held. The week’s two defining events — FOMC Minutes tomorrow at 2:00am and UK CPI at 9:00am — remain ahead, but today’s UK labour market data and Canadian inflation at 3:30pm are the sessions’s primary inputs.
The Fundamental Driver: UK Wages Beat, Unemployment Rises — Stagflation Arrives in Britain
The UK labour market data at 9:00am delivered the clearest stagflation signal in British data since the post-COVID inflation surge. Average Earnings Index 3m/y printed at 4.1% — above the forecast of 3.8% and the prior 3.9%. UK workers are receiving pay rises that are accelerating, not decelerating. That should be good news. But simultaneously, the Unemployment Rate rose to 5.0% — above the forecast of 4.9% and the prior 4.9% — while Claimant Count Change came in at 26.5K (prior 26.8K, slight improvement).
The combination — wages rising at 4.1% while unemployment increases to 5.0% — is textbook stagflation: the labour market is simultaneously tightening on the price side and loosening on the volume side. For the Bank of England, this is the worst possible data configuration. Cutting rates to address rising unemployment risks amplifying the wage-driven inflation. Holding rates to address 4.1% wage growth risks deepening the unemployment rise. The BOE’s May decision to hold at 3.75% with only one dissenting cut vote now looks increasingly fragile — the June meeting will be its most contested in years.
For gold, the UK stagflation print is directly supportive through two channels. Wage-driven inflation above 4% means UK real rates are declining — reducing the opportunity cost of holding gold. And a central bank trapped between inflation and growth — unable to cut without stoking inflation, unable to hold without deepening unemployment — is precisely the environment in which gold’s safe-haven and inflation hedge demand compounds. Tomorrow’s UK CPI at 9:00am will either confirm or challenge today’s wage signal. If CPI comes in above 3.0% alongside today’s 4.1% earnings, the BOE’s path becomes significantly more constrained.
The Chart: Green Zone Holds, Path to $4,660 Is Open
The 15-minute chart has shifted character since Monday’s $4,488 low. Price is now holding above the green demand band at $4,529.497–$4,548.055 — a zone that has absorbed selling on every approach today. The moving averages have crossed upward for the first time since the $4,860 high began correcting, and the Bollinger Bands are re-expanding higher after the NFP-driven compression. The projected path on the chart points directly toward $4,660+ — through the pink resistance bands at $4,567.895 and $4,580–$4,590 — without the corrective dip that characterised last week’s moves. A close above $4,567.895 on a 15-minute basis signals the first pink band has been cleared and the $4,580 area becomes the next target. A close above $4,590 opens the path to $4,635 and $4,660. If price closes below $4,529.497, the demand zone has failed and the $4,488 low comes back into focus — though the structural case for a retest before break is reduced given the momentum of the last 18 hours.
Secondary Data: Japan Beats, NZ Inflation Accelerates, Eurozone Trade Narrows
Japan’s Prelim GDP q/q printed at 0.5% (forecast 0.4%, prior 0.3%) — a beat that confirms Japan’s economy grew faster than expected in Q1. The Prelim GDP Price Index y/y at 3.4% (forecast 3.1%, prior 3.4%) confirms that the growth is accompanied by inflation — USD/JPY faces downward pressure as the BOJ normalisation case strengthens. New Zealand’s PPI Input q/q at 1.4% (forecast 0.8%) and PPI Output q/q at 0.8% (forecast 0.5%) — both beats, confirming tariff-driven producer price acceleration in the Asia-Pacific region. The Eurozone Trade Balance forecast at 5.4B (prior 7.0B) — a narrowing surplus that reflects the twin pressures of weaker export demand and rising import costs from tariff-disrupted supply chains.
Events Ahead
- 3:00pm — FOMC Member Waller speaks: First Fed communication of the week. His framing of last week’s CPI (3.7%) and the tariff-inflation dynamic sets the initial USD tone before Wednesday’s Minutes.
- 3:15pm — ADP Weekly Employment Change (prior 33.0K): Second consecutive weak ADP print would signal private sector hiring is stalling under tariff uncertainty.
- 3:30pm — Canadian CPI: Core CPI m/m forecast 0.7% (prior 0.9%), Common CPI y/y forecast 2.6% (prior 2.6%), Trimmed CPI y/y forecast 2.2% (prior 2.2%). The week’s first major inflation release — a beat would challenge the BOC’s easing path; a miss would accelerate it. CAD direction for the week is set here.
- 5:00pm — Pending Home Sales m/m (forecast 1.0%, prior 1.5%): Secondary US housing data. A miss extends the housing sector stress narrative.
- Wednesday 2:00am — FOMC Minutes: The week’s defining event for gold. Full analysis in the Gold Week Ahead: May 18–23.
Key Levels
- Support: $4,548.055 → $4,529.497 (green demand zone) → $4,488 (weekly low)
- Resistance: $4,567.895 → $4,580–$4,590 (pink band) → $4,635 → $4,660
- Primary target: $4,660+ — no significant corrective dip projected on the current path
- Invalidation: Close below $4,529 — demand zone fails, $4,488 retest
- Bias: Bullish above $4,548 — UK stagflation + Japan GDP beat + Canadian CPI at 3:30pm are today’s catalysts
Yesterday’s analysis called the $4,488 floor and the recovery toward $4,562. That move is underway. Today’s UK wage beat and tomorrow’s FOMC Minutes are adding fundamental weight to the technical recovery. For the full context — including what to watch Wednesday through Friday — see yesterday’s session breakdown at Gold Holds $4,488 — China Misses Confirm the Bull Case and the weekly hub at Gold Week Ahead: May 18–23.
Analysis based on the XAU/USD 15-minute chart as of May 19, 2026, 10:56 UTC+3. Economic data sourced from the daily macro calendar. This article is for informational and educational purposes only and does not constitute financial advice.