
Gold consolidates at $4,508 as global Flash PMIs collapse across Europe and Australia, positioning for the US Claims verdict at 3:30pm.
XAU/USD is trading at $4,508 — holding the $4,465 support floor — as the most comprehensive single-day PMI sweep of the month delivers a uniform message: the global services sector is contracting sharply under the weight of Liberation Day tariff uncertainty. France’s services PMI printed at 42.9. The UK’s at 47.9. Australia shed 18,600 jobs. German manufacturing slipped back below 50. The 15-minute chart projects a dip to $4,502.742 before a recovery toward $4,580+, but the scale of today’s PMI deterioration — if it feeds through to today’s US data at 3:30pm — has the potential to accelerate that move significantly. US Unemployment Claims at 3:30pm is the session’s defining release.
The Fundamental Driver: Global Services Collapse Confirms the Tariff Growth Shock
The morning’s PMI data has delivered the most coherent global growth warning of the entire post-Liberation Day period. The signal is not in any single number — it is in the uniformity of the deterioration across economies, sectors, and geographies that are only loosely connected to each other but all connected to the same underlying force: US trade policy uncertainty.
French Flash Services PMI printed at 42.9 — against a forecast of 46.6 and a prior of 46.5. That is not a miss. That is a collapse. A reading of 42.9 represents a level of services sector contraction not seen in France outside of the COVID lockdowns. French services employ the majority of the country’s workforce and account for the dominant share of its GDP — a reading of 42.9 signals that activity is contracting at a pace that is incompatible with any positive quarterly GDP outcome. French Flash Manufacturing PMI at 48.9 (forecast 52.1, prior 52.8) — also a significant miss, back below 50 into contraction after two months of recovery.
German Flash Manufacturing PMI at 49.9 (forecast 51.0, prior 51.4) — slipping back below the expansion threshold after two consecutive months above 50. The manufacturing recovery that was one of the most encouraging European data points of Q1 has now reversed within a single month. German Flash Services PMI at 47.8 (forecast 47.1, prior 46.9) — a slight beat against the forecast but still firmly in contraction. The composite Eurozone picture is of an economy that was stabilising in Q1 and is now deteriorating in Q2 under the tariff shock.
Eurozone Flash Manufacturing PMI at 51.4 (forecast 51.7, prior 52.2) — decelerating. Eurozone Flash Services PMI at 46.4 (forecast 47.8, prior 47.6) — a significant miss. The services miss is the more important number: European services had been the one sector holding above 48 despite the manufacturing pressure. A fall to 46.4 means both sectors are now contracting simultaneously across the bloc — the first time that has been true since the energy crisis of 2022.
UK Flash Manufacturing PMI at 53.7 (forecast 52.9, prior 53.7) — in line, unchanged. The one European bright spot. UK manufacturing held its expansion level without deterioration — a genuine positive given the broader European trend. UK Flash Services PMI at 47.9 (forecast 51.7, prior 52.7) — a severe miss. UK services fell from 52.7 to 47.9 in a single month — below 50 and below every analyst’s forecast. For the BOE, which has been citing services sector strength as a reason to delay cuts, this reading removes that argument entirely. The June cut probability has jumped substantially on this print.
For gold, the European PMI sweep is structurally supportive through three simultaneous channels. Global growth fears intensify safe-haven demand. Central bank easing expectations across Europe accelerate — ECB and BOE cuts coming sooner, reducing the relative attractiveness of euro and sterling assets and supporting the dollar in the short term but reducing global real rates over the medium term. And the tariff-driven growth shock that gold has been pricing as a risk since Liberation Day is now confirmed in hard, synchronised, cross-continental data.
Australia: Employment Shock Adds to the Picture
The data deterioration is not confined to Europe. Australia’s Employment Change at -18.6K — against a forecast of 16.7K and a prior of 23.3K — is the worst monthly employment print in Australia in over two years. The Australian labour market, which had been one of the most resilient in the Asia-Pacific region, lost nearly 19,000 jobs in April against expectations of a 16,700 gain. Unemployment Rate rose to 4.5% from a prior of 4.3% — a meaningful deterioration in a labour market where the RBA had been citing resilience as a reason to hold rates. MI Inflation Expectations at 5.6% (prior 5.9%) — easing slightly but still elevated. The combination of rising unemployment and sticky inflation expectations is the Australian version of the global stagflation dynamic visible in UK data this week. AUD faces significant pressure and the May RBA cut probability has risen sharply.
Japan’s Flash Manufacturing PMI held at 54.5 (prior 55.1) — the one major economy where manufacturing remains in solid expansion. The Japan Trade Balance at 0.24T yen (forecast -0.23T) — a dramatic positive surprise, Japan’s trade position swinging to a surplus versus an expected deficit. Stronger-than-expected Japanese exports add to the yen-supportive picture alongside rising JGB yields and BOJ normalisation.
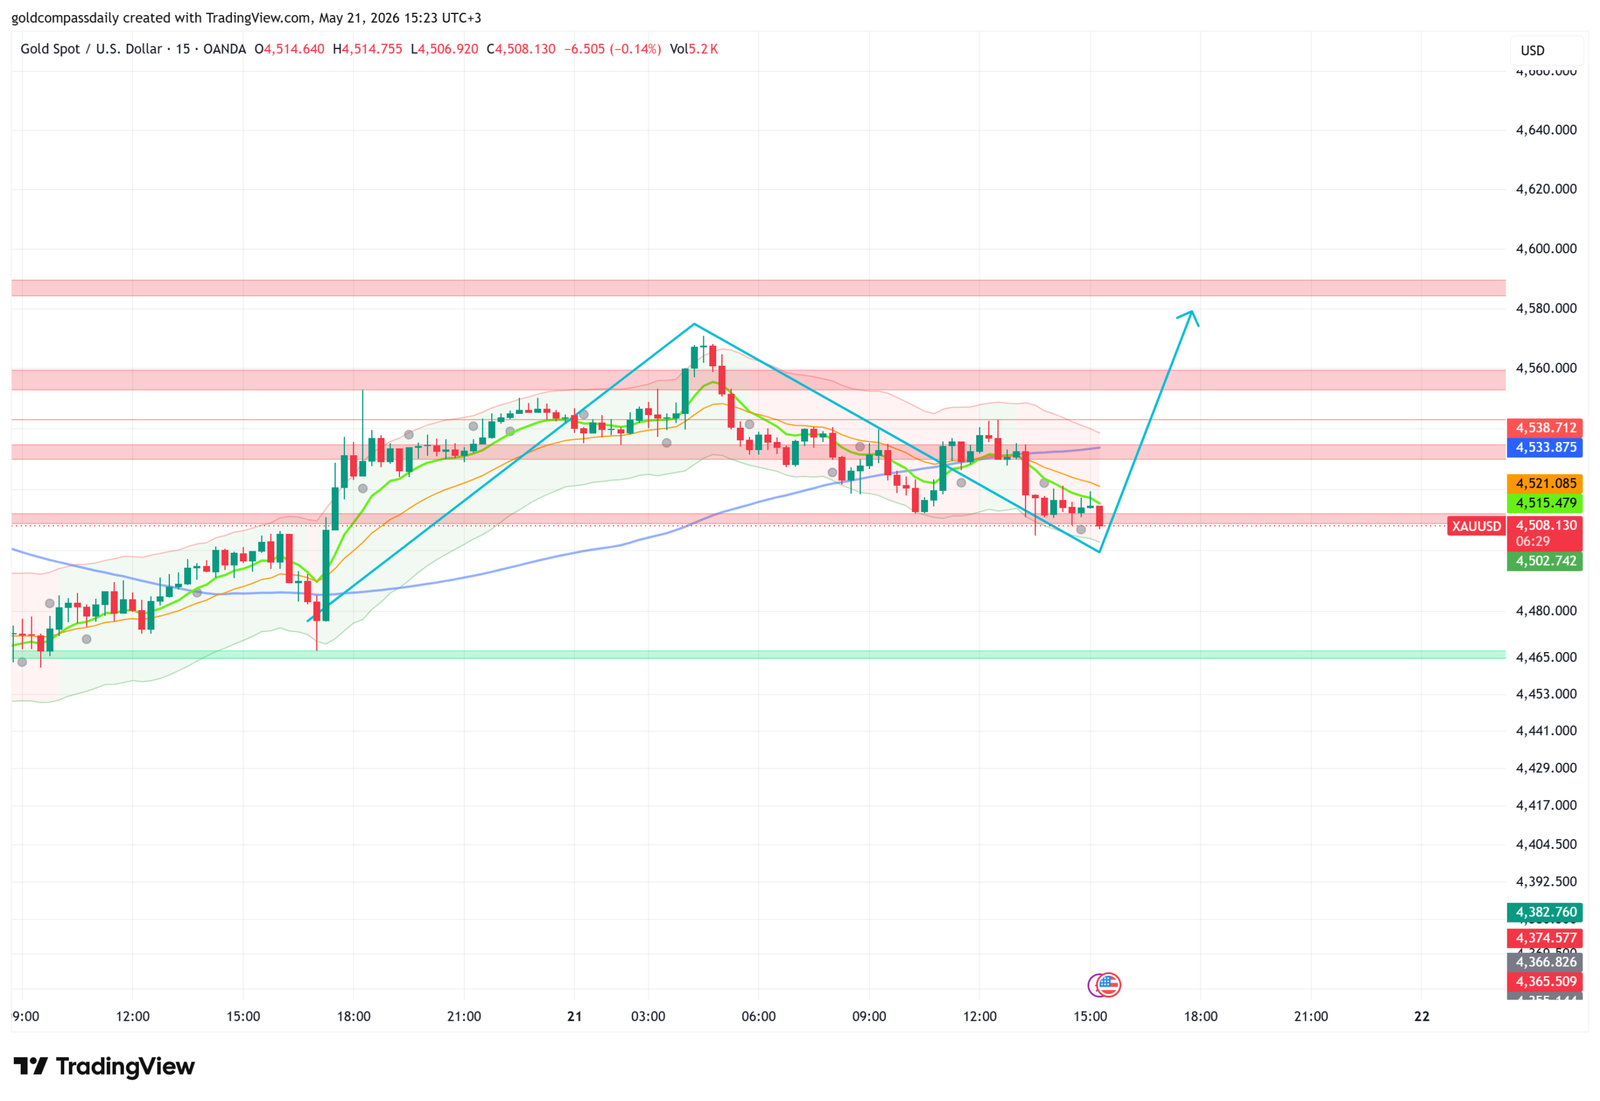
The Chart: Sideways Compression Before the US Data Verdict
The 15-minute chart reflects the uncertainty of a market waiting for a decisive input. Price has been trading in a tight range between $4,502.742 and $4,538.712 since Wednesday’s FOMC Minutes — absorbing the PMI deterioration without a directional break in either direction. The moving averages are flat, the Bollinger Bands are compressed, and volume is below average. This is classic pre-data compression: the market has the European PMI information, it has processed the Australian employment shock, but it is waiting for the US data at 3:30pm before committing to direction.
The projected path shows a dip to $4,502.742 — the lower boundary of the current compression — before the recovery toward $4,580+. A US Claims reading above 220K today, combined with this morning’s European PMI and Australian employment deterioration, would be the most gold-positive combination available and could drive a break above $4,538.712 — the immediate resistance — toward the pink bands at $4,560 and $4,580. A Claims reading below 200K would validate the labour market resilience narrative, strengthen the dollar, and send gold back through $4,502 toward $4,466 — the weekly low support that has held since Monday. A close below $4,465 would be the clearest signal yet that the week’s support structure has broken and the $4,374–$4,382 green bands at the bottom of the chart become the next reference.
Secondary Data: NZ Trade Surplus, CBI Industrial Orders, Philly Fed
New Zealand’s Trade Balance printed at 1,920M (forecast 980M, prior 430M) — a dramatic improvement driven by commodity export strength. NZD receives a positive boost. UK CBI Industrial Order Expectations at -41 (forecast -40, prior -38) — a slight miss, UK industrial confidence deteriorating further consistent with today’s services PMI collapse. The Philly Fed Manufacturing Index at 1.40 (forecast 17.6, prior 26.7) — a significant miss on the US regional manufacturing survey that is the first piece of today’s US data sequence, arriving 15 minutes before Claims at 3:30pm. A Philly Fed print below 5 would add to the PMI deterioration narrative and increase the probability of a weak Claims number.
Events Ahead
- 3:30pm — Unemployment Claims (USD): Forecast 210K (prior 211K). Today’s most important release. Above 225K = global slowdown confirmed in US labour data = gold breaks above $4,538 toward $4,580. Below 200K = dollar strengthens = gold tests $4,466.
- 3:30pm — Building Permits (USD): Forecast 1.38M (prior 1.37M). Housing sector health check — secondary input.
- 3:30pm — Housing Starts (USD): Forecast 1.42M (prior 1.50M). Expected decline — adds to the housing sector stress narrative.
- 4:45pm — US Flash Manufacturing PMI: Forecast 53.8 (prior 54.5). If US manufacturing decelerates alongside European contraction, the global PMI picture becomes uniformly negative — most gold-positive scenario.
- 4:45pm — US Flash Services PMI: Forecast 51.1 (prior 51.0). Watch the Services number specifically — a miss below 50 on the same day that France printed 42.9 would be a global services contraction signal of historic significance.
- 5:00pm — Consumer Confidence (EUR): Forecast -21 (prior -21). Eurozone consumer mood following the PMI collapse.
- 6:00pm — BOE Gov Bailey speaks (GBP): His first public appearance after today’s UK services PMI collapse to 47.9. Bailey’s characterisation of the services deterioration — whether it is tariff-driven and temporary or structural — will directly reset June cut probability.
- Full week context: Gold Week Ahead: May 18–23
Key Levels
- Support: $4,502.742 (compression floor) → $4,465 (weekly low support) → $4,374–$4,382 (deep green bands)
- Resistance: $4,521.085 → $4,533.875 → $4,538.712 → $4,560–$4,580 (pink bands)
- Bull trigger: Claims above 225K + US PMI miss = close above $4,538 → $4,580 target
- Bear trigger: Claims below 200K = close below $4,466 → $4,374 next
- Bias: Neutral-bullish above $4,502 pending US data — European PMI collapse and Australian employment shock provide fundamental support
The week has built a coherent and consistent narrative: global services are contracting, labour markets are deteriorating outside the US, and the tariff shock is now visible in synchronised PMI data across Europe, Australia, and Asia. Monday’s China misses, Tuesday’s UK stagflation signal, and Wednesday’s CPI miss and FOMC Minutes have each added a layer to the same story. Today’s US Claims and PMIs at 3:30–4:45pm are the final chapter of the week — the moment when the US data either confirms or diverges from everything the rest of the world is reporting. If it confirms, gold’s path to $4,580 and beyond is clear.
Analysis based on the XAU/USD 15-minute chart as of May 21, 2026, 15:23 UTC+3. Economic data sourced from the daily macro calendar. This article is for informational and educational purposes only and does not constitute financial advice.