
Gold trades cautiously bullish at $4,321 on Thursday, staging a measured recovery from Wednesday’s sharp selloff that drove price briefly below $4,220 following the FOMC dot plot release. The rebound structure is constructive, but the metal must reclaim the $4,328–$4,337 supply cluster to confirm that the corrective phase has ended. The Bank of England rate decision and US jobless claims — both due this afternoon — represent the session’s dominant price catalysts.
Key Levels
- Bias: Cautiously Bullish above $4,317
- Support: $4,317–$4,319 (demand zone, Bollinger Band lower boundary) → $4,309 → $4,292
- Resistance: $4,328–$4,329 (VWAP / intraday pivot) → $4,334–$4,338 (supply cluster) → $4,343
- Session target: $4,355–$4,365 (conditional on reclaiming $4,337 with sustained volume)
- Invalidation: Below $4,309 — higher-low structure fails; opens path back toward $4,292
Catalyst of the Day
The Bank of England’s Monetary Policy Summary and Official Bank Rate decision, due at 2:00 PM UTC+3, are the session’s primary macro catalyst. Markets price the rate at 3.75% with an expected 1-0-8 vote split — a hold with one dissenter advocating a cut. A surprise dovish shift in the MPC vote tally, or language signalling accelerated easing, would weaken sterling and reinforce the broader narrative of developed-market central banks pivoting toward rate reductions. That environment historically supports gold by compressing real yield differentials and reducing the opportunity cost of holding non-yielding assets. The accompanying US Unemployment Claims print at 3:30 PM UTC+3 (consensus 225K versus prior 229K) adds a second pressure point: a materially weak reading would amplify safe-haven demand and reinforce the post-FOMC recovery bid in gold.
Fundamental Context
Wednesday’s FOMC dot plot delivered a hawkish surprise — the median projection shifted to fewer cuts in 2026 than markets had priced — triggering the sharp $100+ intraday drop visible on the chart. However, the selloff found buyers quickly below $4,225, suggesting that the underlying structural bid for gold remains intact. The Fed’s caution on easing is already reflected in the forward curve, which limits the additional downside from that specific repricing. What matters now is whether the macro data flow over the next 48 hours reinforces or undermines the rate-cut narrative that has supported gold’s broader uptrend since early 2026.
UK labour market data released this morning showed Average Earnings at 4.0% (versus 4.1% prior), with Unemployment holding at 5.0% and Claimant Count at 25.8K (down from 26.5K). The modest cooling in wage growth gives the BoE marginal room to lean dovish — a message that, if reflected in today’s MPC vote or accompanying statement, would reinforce the global easing narrative. Meanwhile, the SNB cut rates to 0.00% at 10:30 AM UTC+3, continuing a sequence of European central bank easing that collectively supports gold by reducing the real return advantage of currency-denominated assets.
Chart Analysis
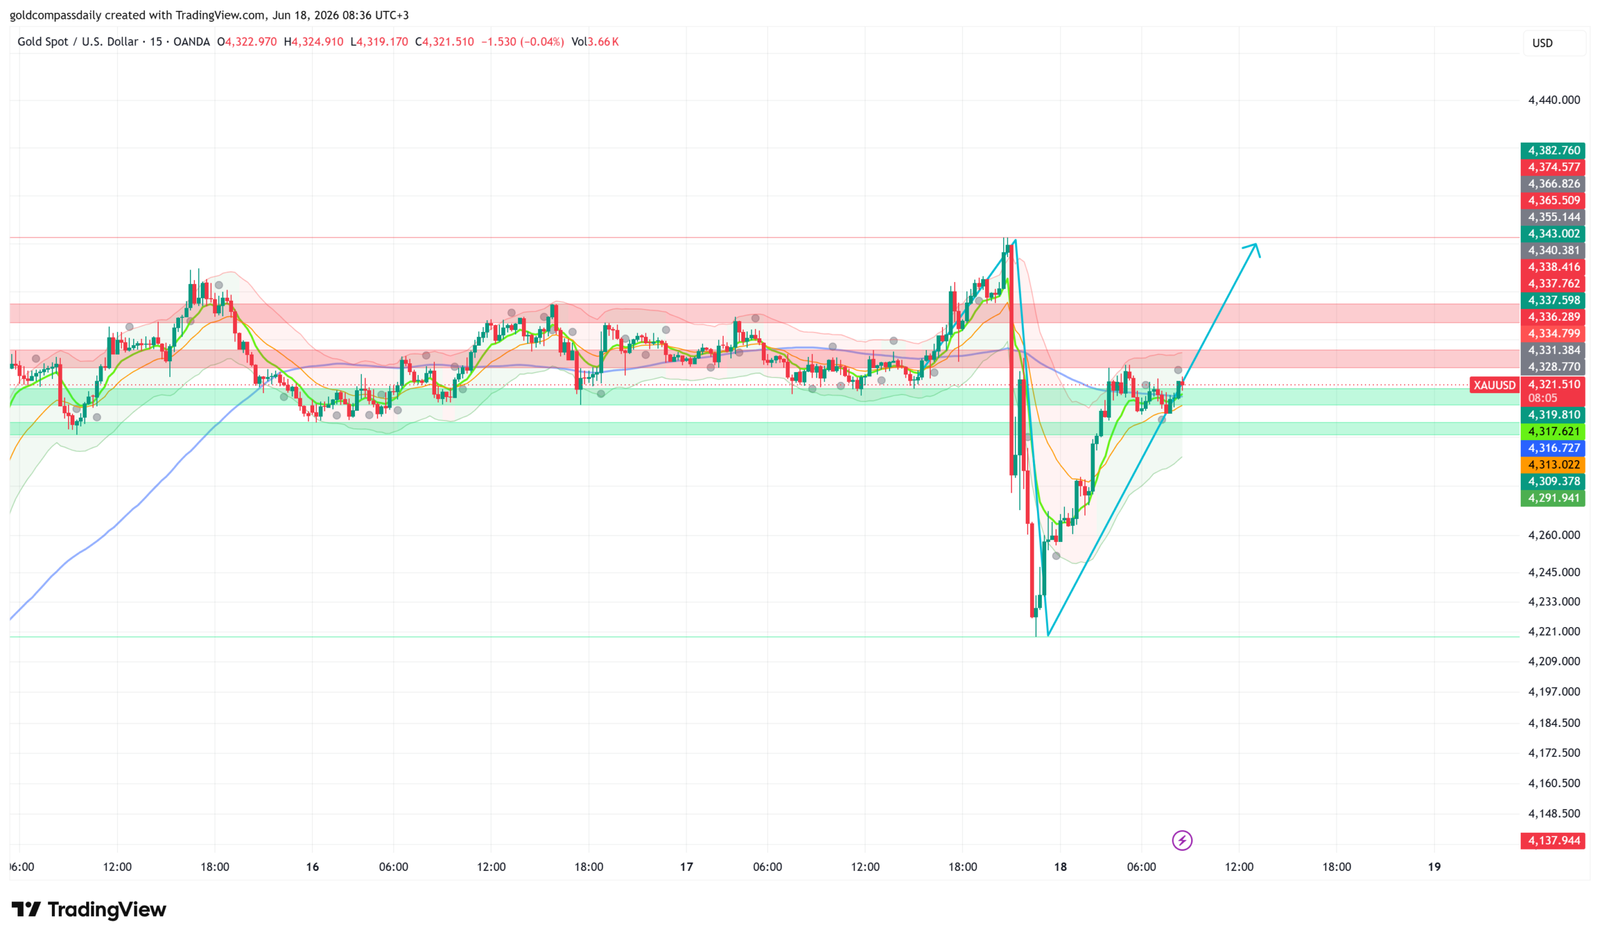
The 15-minute XAU/USD chart as of 08:36 UTC+3 on June 18 shows a V-shaped recovery structure unfolding from the post-FOMC spike low near $4,221. Price has climbed back into the $4,317–$4,322 area, which aligns with the lower boundary of the Bollinger Band and a key horizontal support-turned-resistance level. The orange short-period EMA has curled upward and is beginning to converge toward the mid-band, confirming near-term momentum recovery. The annotated cyan arrow projects a continuation higher toward the $4,337–$4,343 supply cluster, consistent with the bullish recovery thesis. The green demand zone band ($4,313–$4,319) is currently acting as the structural base of the rebound — as long as price holds above this zone on pullbacks, the higher-low structure remains intact. The dense resistance stack on the right-hand price ladder ($4,328, $4,334, $4,337, $4,340, $4,343) indicates that bulls face layered supply on the way up, and a clean break above $4,343 would materially change the intraday posture toward the $4,355–$4,366 range.
Bull / Bear Scenarios
Bull Scenario
Trigger: Price reclaims and holds above $4,337 on a 15-minute close, confirmed by BoE hold with a dovish tone or US claims above 230K (labour weakness). Target: $4,355 initially, with extension toward $4,365–$4,374 if volume confirms the breakout.
Bear Scenario
Trigger: Price fails at $4,328–$4,329 and breaks back below $4,317 on sustained selling, triggered by hawkish BoE surprise or strong US claims data (below 215K). Target: $4,309, with secondary risk toward $4,292 if the green demand zone gives way.
Events Ahead
- Thu 2:00 PM UTC+3 — BoE Rate Decision & MPC Vote (3.75% exp., 1-0-8 vote split): Dovish tilt in the vote supports gold; any shift toward more cuts accelerates the easing narrative.
- Thu 3:30 PM UTC+3 — US Unemployment Claims (225K exp.): Weak labour data reinforces Fed caution and supports gold’s safe-haven bid.
- Thu 3:30 PM UTC+3 — Philly Fed Manufacturing Index (9.8 exp., prior -0.4): A miss extends USD weakness, adding a tailwind to gold’s recovery.
- Thu 5:00 PM UTC+3 — US CB Leading Index m/m (0.1% exp.): A soft reading compounds the growth-slowdown narrative that underpins gold demand.
- Fri — Week Ahead Hub: Refer to Gold Compass Daily’s Week Ahead: June 15–19 — FOMC Decision in Focus for the full macro context framing this week’s price action.
For context on Wednesday’s session and the FOMC-driven selloff that set up today’s recovery, see: Gold Holds $4,327 Ahead of FOMC Dot Plot — The Real Risk.
The immediate session priority is the $4,328–$4,337 resistance band. A confirmed break above $4,337 before the BoE announcement shifts the probability in favour of bulls targeting $4,355 into the afternoon. Failure to reclaim that zone before the US data window opens the door to a retest of $4,309, which would be the last clean support level before the post-FOMC recovery structure is invalidated.
New York Session Update
Price Check
Gold trades at $4,269 as of 16:35 UTC+3, having failed to sustain the morning recovery thesis. The cautiously bullish bias outlined in Gold Compass Daily’s morning analysis has not held — price broke below the $4,317 invalidation level and extended losses into the $4,241–$4,269 range, shifting the intraday structure from recovery to continued distribution.

What Changed
The $4,328–$4,337 resistance cluster that the morning analysis identified as the critical reclaim level proved insurmountable. Price tested that zone in early European trade, failed to close above it on a 15-minute basis, and rolled over sharply through the New York open. The BoE held rates at 3.75% as expected, but the MPC vote and accompanying statement did not deliver the dovish tone that would have supported gold’s recovery bid. US Unemployment Claims came in at 227K — broadly in line with the 225K consensus — providing no meaningful catalyst for safe-haven demand. The absence of a macro trigger to drive a directional break higher left gold exposed to the overhead supply cluster, and sellers regained control once the $4,309 support gave way. Price printed a session low at $4,241 before a partial recovery bounce brought it back to the current $4,269 area. The broader channel structure now in focus is $4,220–$4,400, with price consolidating in the lower half of that range.
Updated Levels
- Current price: $4,269
- Bias now: Neutral-to-bearish — morning bullish bias invalidated below $4,309; recovery attempts capped by dense supply above $4,284–$4,294
- Updated support: $4,257–$4,263 (current demand cluster) → $4,241 (session low) → $4,220 (channel base)
- Updated resistance: $4,284 → $4,294 → $4,309–$4,312 (prior support, now supply)
- NY session target: $4,294–$4,309 on a recovery close, or retest of $4,241 if $4,257 fails
Scenarios Into the Close
Bull: Price holds above $4,257 and reclaims $4,284 on a 15-minute close, opening a path toward the $4,294–$4,309 supply zone into the New York close. Bear: A sustained break below $4,257 on volume targets the $4,241 session low, with extension risk toward the $4,220 channel base if selling accelerates into thin late-session liquidity.
Chart Analysis
The 15-minute chart as of 16:35 UTC+3 shows a clear deterioration from the morning’s V-shaped recovery structure. Price peaked near $4,320 in early European trade and has since printed a sequence of lower highs and lower lows, with the short-period orange EMA crossing below the mid-band and beginning to converge toward the lower Bollinger Band boundary. The current price of $4,269 sits between the $4,263 and $4,272 horizontal levels visible on the right-hand price ladder, with the annotated cyan arrow now projecting a potential recovery path back toward $4,294 — though the blue EMA curve on the chart is angled lower, suggesting the broader mean-reversion pressure favors the downside. The $4,309 level, which served as a key support reference in the morning analysis, is now acting as overhead resistance within the established $4,220–$4,400 channel. A close above that level would be required to meaningfully change the short-term bias back toward neutral.
Analysis based on the XAU/USD 15-minute chart as of June 18, 2026, 08:36 UTC+3. This article is for informational and educational purposes only and does not constitute financial advice.