
Gold trades bearish at $4,127 — down sharply from yesterday’s $4,195 recovery high as a resurgent dollar and risk-on sentiment triggered by better-than-expected global PMI readings drained safe-haven demand. The metal has broken below the $4,135–$4,150 support cluster, with chart structure pointing toward a test of the $4,098–$4,100 zone if selling pressure extends through the New York session.
Key Levels
- Bias: Bearish below $4,150
- Resistance: $4,135 → $4,150 → $4,168
- Support: $4,120 → $4,098–$4,100
- Session target: $4,098 (conditional on US PMI beat and no reversal above $4,135)
- Invalidation: Reclaim of $4,150 on a closing 15-minute candle = bear thesis cancelled, neutralises to range
Catalyst of the Day
The primary catalyst for Monday’s session is the 4:45 PM UTC+3 release of US Flash Manufacturing and Services PMI figures. Manufacturing is forecast at 54.6 (prior 55.1) and Services at 51.1 (prior 50.7). A reading that meets or beats expectations would reinforce the narrative that the US economy remains resilient, reducing the Fed’s urgency to cut rates and lifting real yields — both headwinds for non-yielding gold. A miss, particularly in Services, would be the sole near-term catalyst capable of reversing the current bearish structure and pushing gold back toward $4,150. Watch the 4:45 PM release for the directional confirmation.
Fundamental Context
The macro backdrop has shifted against gold through the early European session. Flash PMI data released across Asia and Europe printed broadly above prior readings: Australian Manufacturing came in at 51.2 versus a 50.7 prior, Japanese Manufacturing held at 54.9, German Manufacturing edged to 50.3, and Eurozone Manufacturing matched its 51.6 prior. A consistent picture of stabilising global factory activity reduces the global recession premium that had been supporting gold’s safe-haven bid near the $4,200 handle. When growth data beats across multiple regions simultaneously, capital tends to rotate out of defensive assets into risk.
The dollar’s resilience is the transmission mechanism. Stronger-than-expected PMI data in the US last week, combined with FOMC members maintaining a cautious tone on rate cuts, keeps real yields elevated. Gold’s inverse relationship with the US 10-year real yield remains the dominant structural driver: every basis point of upward pressure on real rates compresses gold’s non-yielding return advantage. With FOMC Member Goolsbee speaking early in the session and Thursday’s Core PCE release still ahead — the week’s defining macro event as detailed in the weekly hub — the risk-reward for chasing the downside accelerates on confirmation from today’s US PMI print.
Chart Analysis
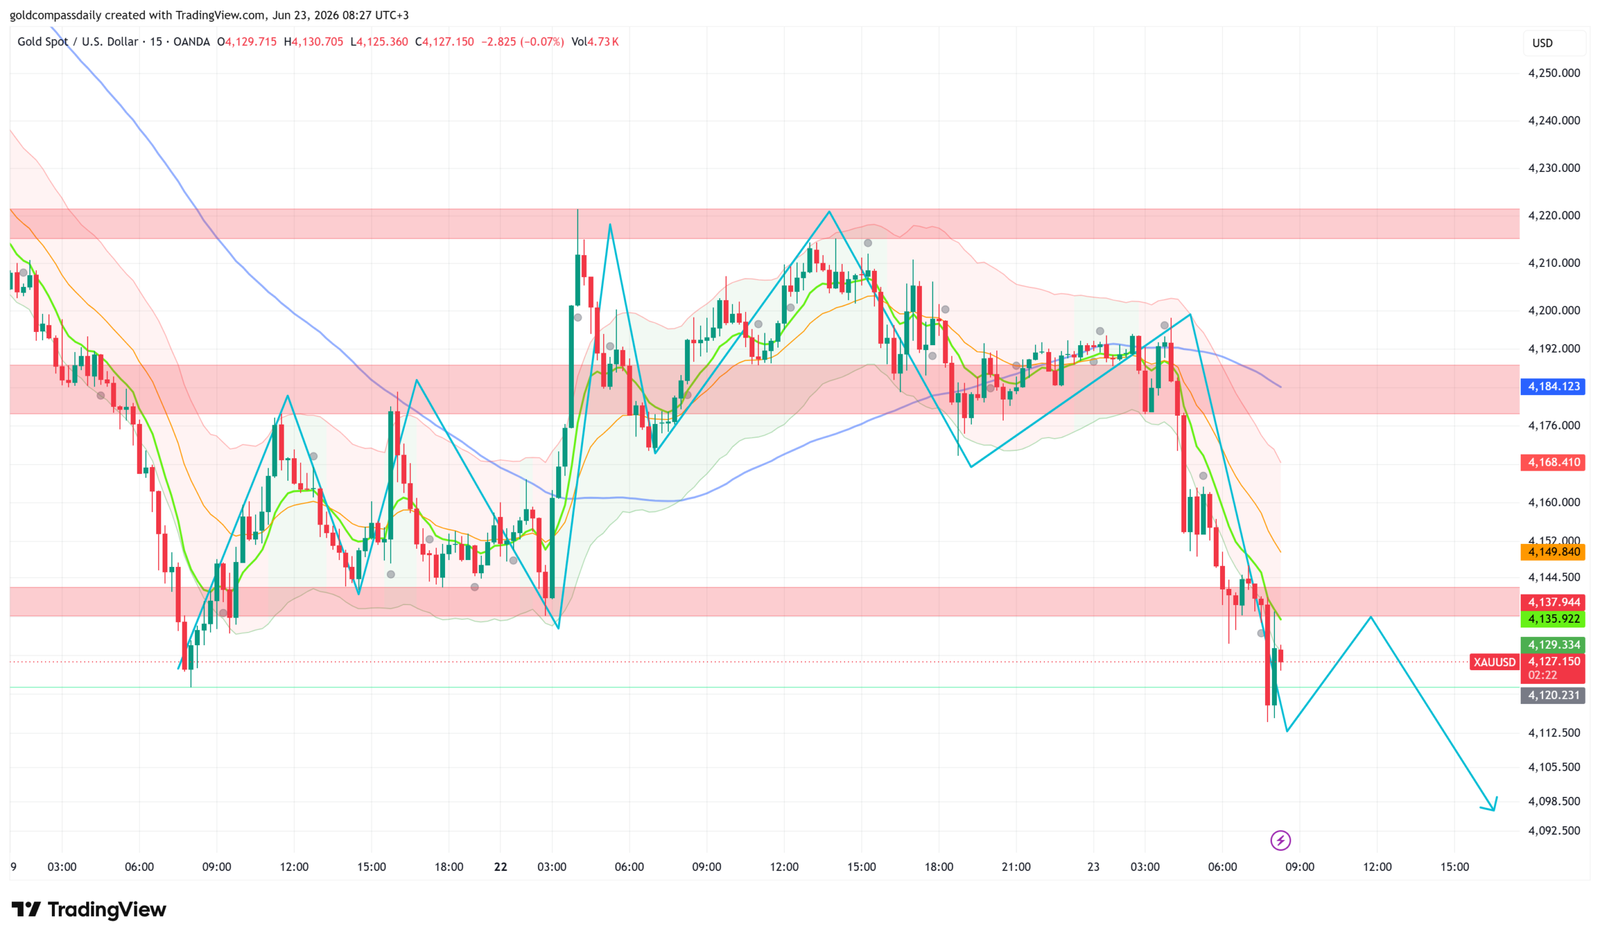
The 15-minute XAU/USD chart shows a decisive structural breakdown following a prolonged consolidation in the $4,192–$4,210 range across June 22. Price broke below the Bollinger Band midline and the short-term EMA stack (green and orange MAs now crossed bearish) beginning in the early hours of June 23, accelerating through the $4,135–$4,137 demand zone before printing a session low near $4,120. The blue long-period MA, which had been trending down since June 9, continues to act as dynamic overhead resistance — currently located near $4,184. The Bollinger Bands are wide and pointing lower, confirming momentum is with the sellers. The projected path drawn on the chart targets a continuation toward $4,098–$4,100, with a minor bounce potential from $4,120 before the next leg lower. The $4,150 level — former support now flipped resistance — is the first structural test for any intraday recovery attempt.
Bull / Bear Scenarios
Bear Scenario
Trigger: US Flash PMI (4:45 PM) meets or beats consensus AND price holds below $4,135 on the reaction candle → Target: $4,098–$4,100. A move through $4,120 on volume confirms the next leg lower. This is the base case given current EMA alignment and dollar strength.
Bull Scenario
Trigger: US Flash Services PMI misses significantly (below 49.5) OR Goolsbee adopts a dovish tone that reprices rate cut expectations → gold reclaims $4,150 on a closing basis → Target: $4,168, then $4,184. This scenario requires both a catalyst miss and a structural reclaim — not a base case for Monday.
Events Ahead This Week
- Monday, 4:45 PM UTC+3 — US Flash Manufacturing PMI (54.6f) & Services PMI (51.1f): Primary directional trigger for today’s session; beat = dollar bid, gold lower; miss = only near-term bull catalyst.
- Monday, 3:15 PM UTC+3 — ADP Weekly Employment Change (25.5K prior): Proxy for labour market strength; stronger print adds to hawkish Fed narrative, additional pressure on gold.
- Thursday, time TBC — US Core PCE (May): The week’s defining macro event. As covered in Gold Week Ahead: June 23–27, a hot reading above 2.6% y/y would cement Fed caution and extend gold’s downside. A softer print is the only event capable of reversing the weekly bearish structure.
- Friday — FOMC Member speeches (rolling): Any shift in rate cut signalling — particularly language around July — will move gold intraday.
With the EMA stack bearish, the Bollinger Bands open to the downside, and the macro data calendar biased toward dollar-supportive outcomes, Gold Compass Daily’s base case for Monday’s New York session is a continuation lower toward $4,098–$4,100. Yesterday’s recovery to $4,195 — covered in Monday’s prior analysis — has fully reversed. Bears retain structural control unless a material PMI miss forces a repricing of Fed expectations before Thursday’s Core PCE.
New York Session Update
Price Check
Gold is trading at $4,115 at the time of this update, extending the bearish move projected in Gold Compass Daily’s morning analysis. The morning sell thesis has held — price broke below $4,120 and has since been carving out a declining channel rather than staging any meaningful recovery.

What Changed
US Flash PMI data released at 4:45 PM UTC+3 delivered a mixed outcome that initially triggered a bounce attempt but failed to generate sustained buying. The more consequential development is the formation of a compression channel between $4,090 and $4,134, with price oscillating inside this range throughout the New York afternoon. The channel is not a base-building structure — it is a consolidation within a downtrend, with each rally capped below the former $4,135 support level now acting as resistance. No fundamental catalyst has emerged to challenge the bear case; dollar resilience persists and real yield pressure has not relented into the close.
Updated Levels
- Current price: $4,115
- Bias now: Bearish — unchanged. Channel consolidation below $4,135 confirms continued seller control.
- Updated support: $4,090 (channel floor) → $4,097–$4,100 (structural zone)
- Updated resistance: $4,120 → $4,134 (channel ceiling) → $4,150
- NY session target: $4,090 channel floor on a clean break lower; extension toward $4,065–$4,070 if channel breaks to the downside on volume
Scenarios Into the Close
Bull: A closing 15-minute candle above $4,134 with follow-through volume would signal a channel breakout to the upside, opening a retest of $4,150 — this remains a low-probability outcome without a fresh fundamental catalyst. Bear: A break below $4,090 on a closing basis confirms channel resolution to the downside and activates the $4,065–$4,070 extension target into Tuesday’s Asian session.
Chart Analysis
The 15-minute chart as of 15:58 UTC+3 shows price firmly entrenched in a declining channel bounded by $4,090 support and $4,134 resistance, with the most recent candles printing near $4,115. The short-term EMA stack (green and orange) remains negatively aligned and is converging just below $4,135, reinforcing that level as dynamic resistance. The blue long-period MA has rolled sharply lower and now sits near $4,154, adding a further layer of overhead supply. Bollinger Bands remain expanded and open to the downside, with the midline acting as resistance on each intraday bounce attempt. The projected path annotated on the chart targets a move toward $4,089–$4,090 as the next significant level, with the bear case extending to the $4,065 area on a confirmed breakdown. No bullish divergence or reversal pattern is visible at current structure.
Analysis based on the XAU/USD 15-minute chart as of June 23, 2026, 08:27 UTC+3. This article is for informational and educational purposes only and does not constitute financial advice.