
Gold trades cautiously bullish at $4,077 on Tuesday, recovering from a session low of $4,054 as dollar strength shows early signs of fading heading into a light but event-rich U.S. afternoon session. The metal remains under structural pressure following last week’s sharp decline from the $4,309 peak, but the 15-minute chart shows buyers stepping in at the lower demand zone, with the projected path pointing toward a retest of $4,138–$4,200 resistance before Thursday’s Core PCE.
For the weekly macro context, see Gold Compass Daily’s Week Ahead Hub: June 23–27 — Core PCE and PMI Data in Focus. Monday’s session is covered in Gold Slides to $4,127 as PMI Data and Dollar Strength Weigh.
Key Levels
- Bias: Cautiously Bullish above $4,054 (session low / demand zone)
- Support: $4,065 → $4,054 (session low, critical near-term floor)
- Resistance: $4,095 → $4,107 → $4,120 → $4,138 (confirmed resistance shelf)
- Session target: $4,138–$4,145 (conditional on U.S. data coming in soft and dollar retreating)
- Extended target: $4,180–$4,200 zone (aligns with chart projection if recovery extends into Wednesday)
- Invalidation: Break and close below $4,054 = demand exhausted, opens path toward $4,020–$4,000
Catalyst of the Day
The primary catalyst for Tuesday’s session is the U.S. New Home Sales print at 5:00 PM UTC+3 (forecast: 638K vs prior 622K), followed by Bank Stress Test Results at 11:00 PM UTC+3. A stronger-than-expected housing print would reinforce the “resilient U.S. economy” narrative, reducing the Fed’s urgency to cut — a headwind for gold. Conversely, a miss would ease real yield expectations and provide room for XAU/USD to push toward the $4,138 resistance. The stress test results, while equity-centric, could move risk sentiment broadly and affect safe-haven demand into the Asian open. Watch the 5:00 PM UTC+3 release for the directional trigger.
Fundamental Context
Australia’s CPI data released early Tuesday delivered a notable downside surprise, with the monthly CPI falling 0.7% against a forecast of -0.4% and a prior reading of +0.4%. The annual rate printed at 4.0%, below the 4.3% forecast. While AUD-specific, the data reinforces a global disinflationary trend that has begun to weigh on the U.S. dollar’s relative safe-haven premium. For gold, broad disinflation outside the U.S. reduces the argument for aggressive Fed tightening while simultaneously supporting the case for rate cuts further out — a medium-term tailwind for the metal.
The German ifo Business Climate for June (forecast: 85.6 vs prior 84.9) due at 11:00 AM UTC+3 adds to the European demand picture. Deteriorating European growth sentiment typically drives flows toward dollar-denominated safe havens, but with the ECB already in a dovish pivot and European sovereign yields retreating, the impact on gold tends to be directionally positive if the data disappoints materially. The U.S. Current Account deficit print at 3:30 PM UTC+3 (forecast: -$212B vs prior -$191B) serves as a secondary dollar indicator — a wider deficit can suppress USD strength and provide near-term support for gold.
Chart Analysis
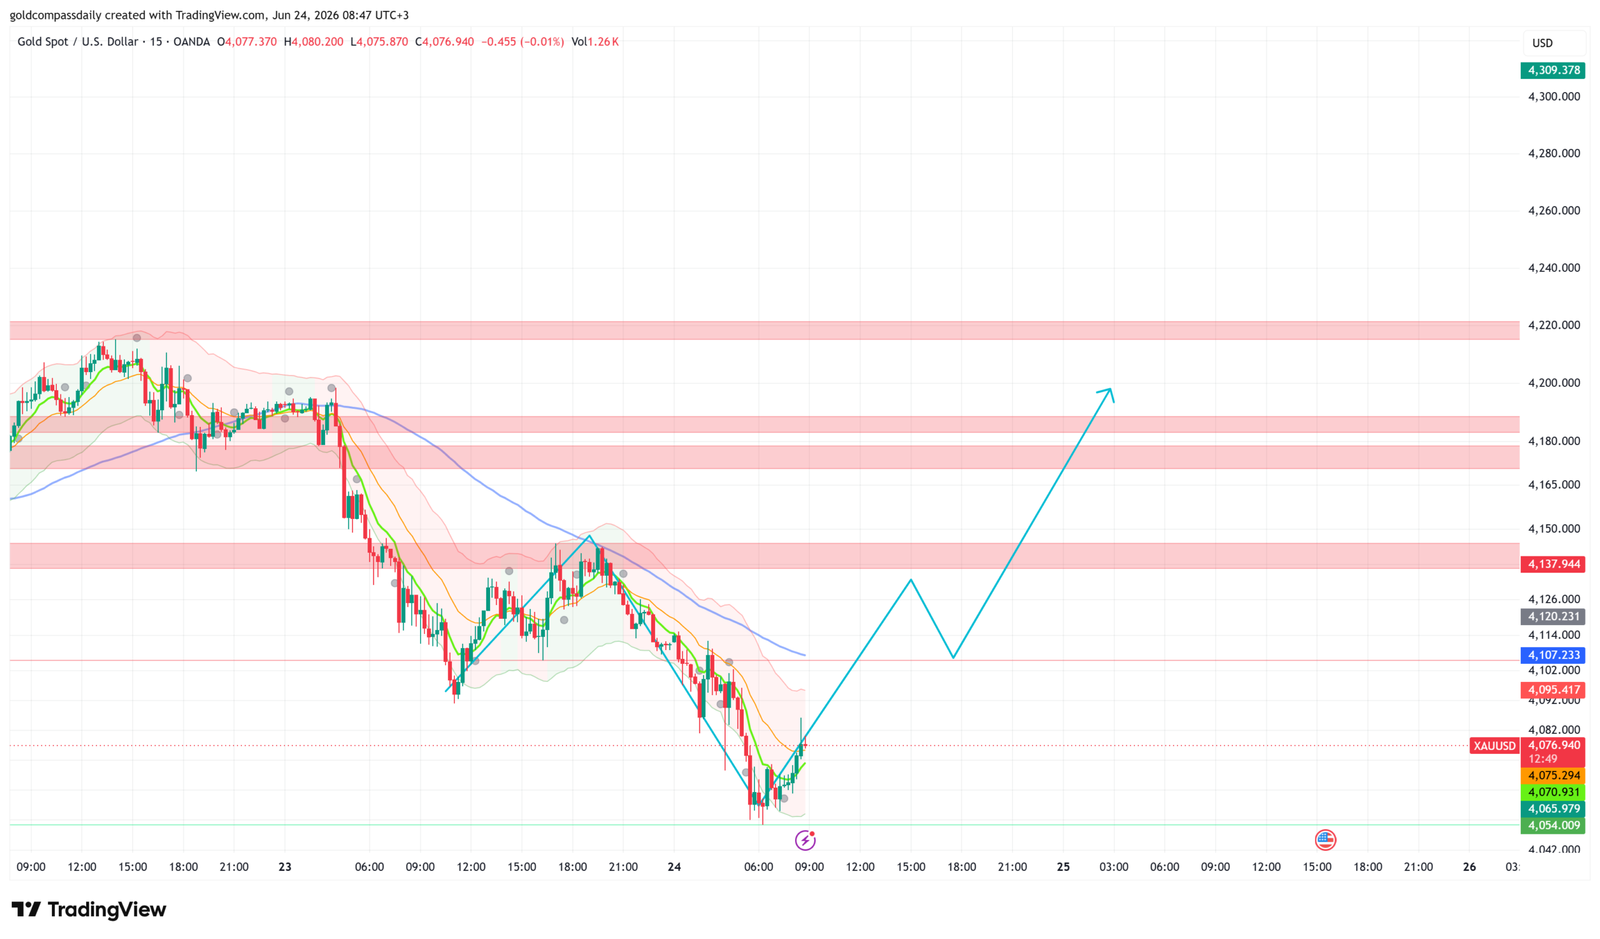
The XAU/USD 15-minute chart as of 08:47 UTC+3 shows price at $4,076.94 after printing a session low of approximately $4,054 in the early morning hours of June 24. The decline from the $4,309.38 high (visible at the top of the chart) has been sustained and structured, with price trading well below the 200-period simple moving average — now acting as dynamic resistance near $4,165–$4,180. The shorter-period EMAs (yellow and green) remain in a bearish stack above current price, with the Bollinger Bands contracted and lower band previously tagged at the session low. The chart’s projected path annotation shows a V-shaped recovery sequence: a base near $4,054–$4,065 → bounce toward $4,107–$4,120 → pullback → continuation toward $4,180–$4,200 by the June 25 session. The $4,137.94 level is marked as a confirmed resistance shelf on the right side of the chart. For the bullish scenario to develop, price must first reclaim $4,095 and then $4,107 on a closing basis, which would confirm demand absorption at the current floor.
Bull / Bear Scenarios
Bull Scenario
Trigger: Price holds above $4,065 and closes a 15-minute candle above $4,107 during or after the New Home Sales release.
Target: $4,138 initial resistance → $4,165–$4,180 extended target into Wednesday’s session.
Confirmation: EMA stack begins to compress and flatten; Bollinger Bands widen upward.
Bear Scenario
Trigger: New Home Sales beat forecasts significantly and USD strengthens; price breaks and closes below $4,054 on the 15-minute chart.
Target: $4,020 → $4,000 psychological support.
Confirmation: No recovery within two candles of the break; price opens the U.S. session below $4,065.
Events Ahead This Week
- Tuesday, 5:00 PM UTC+3 — U.S. New Home Sales (forecast: 638K): Housing strength extends the “no-cut needed” Fed narrative — bearish for gold on a beat.
- Tuesday, 11:00 PM UTC+3 — U.S. Bank Stress Test Results: Systemic risk signal; a failure in major banks would spike safe-haven demand for gold.
- Wednesday — U.S. Durable Goods Orders: Forward-looking demand indicator; weak print supports gold’s rate-cut thesis.
- Thursday — U.S. Core PCE (May): The defining macro event of the week. A print at or below 2.6% y/y would be a strong gold catalyst; a beat above 2.8% would compress gold sharply.
- Friday — U.S. Consumer Sentiment (final): Secondary sentiment read; watch for inflation expectations component which directly affects real yield pricing.
Analysis based on the XAU/USD 15-minute chart as of June 24, 2026, 08:47 UTC+3. This article is for informational and educational purposes only and does not constitute financial advice.