

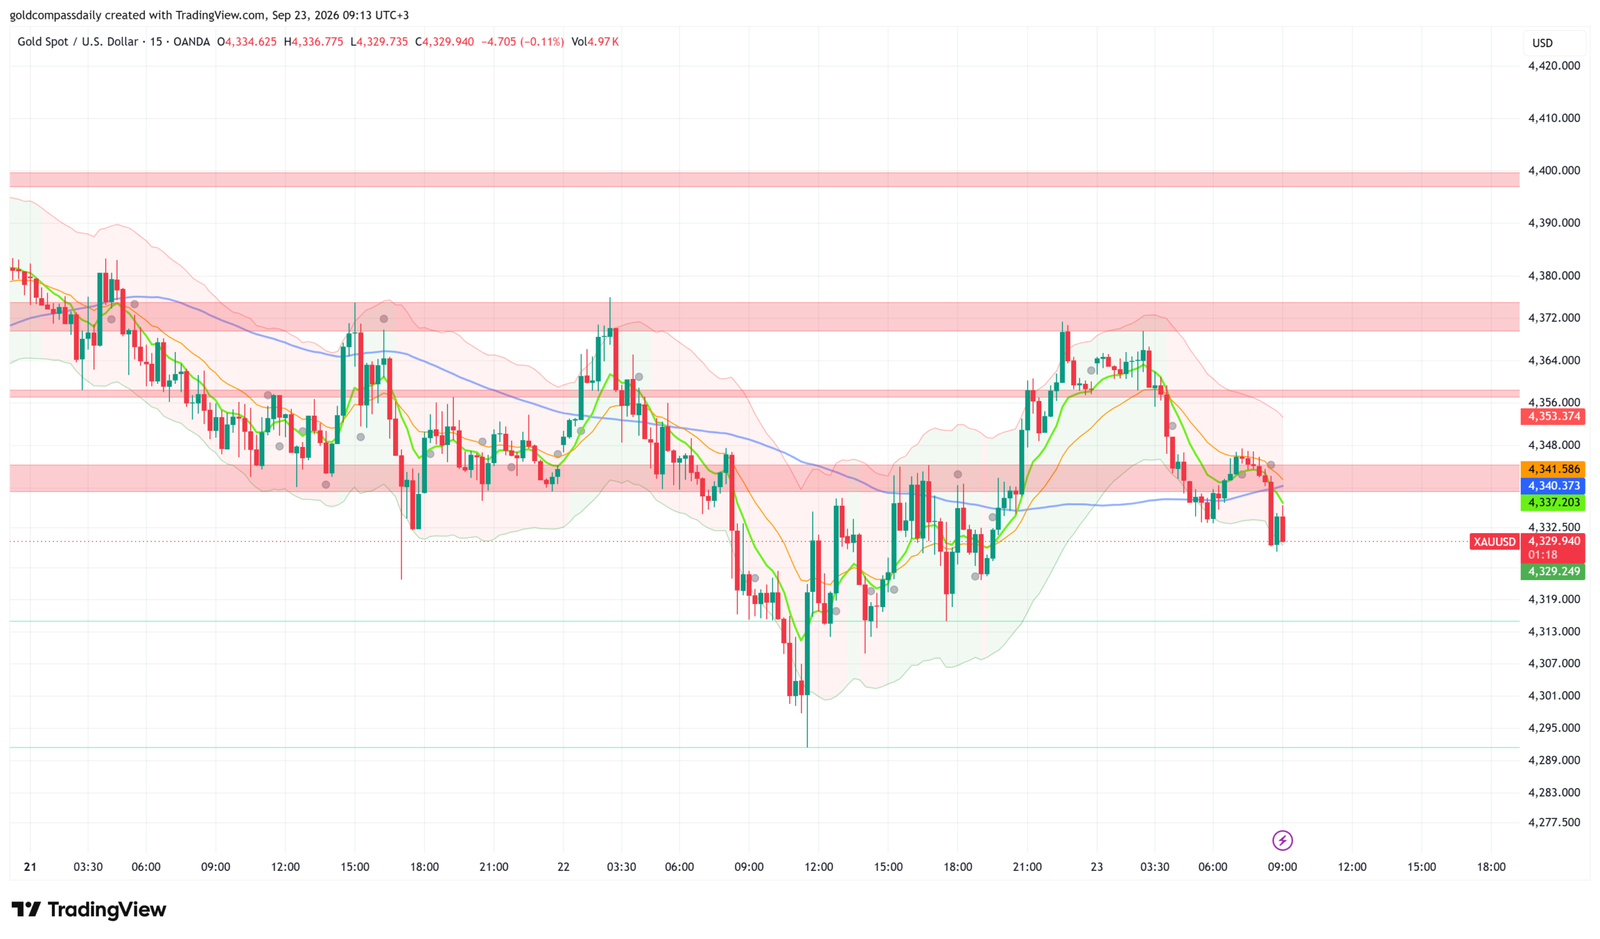
Gold trades cautiously bullish at $4,329.94 — London opens with a measured pullback from Tuesday’s $4,372 recovery high as price retests the $4,330 support cluster, with Wednesday’s flash PMI prints serving as the session’s primary directional filter. The structural bias remains to the upside while price holds above $4,319, but a clean break lower would shift the session narrative toward a deeper corrective move before the US PMI window at 4:45 PM EST.
Key Levels
- Bias: Cautiously Bullish above $4,319
- Support: $4,330 → $4,319 → $4,301
- Resistance: $4,341 → $4,356 → $4,372
- Session target: $4,356 — conditional on PMI beats and price reclaiming $4,341
- Invalidation: Below $4,319 = bears regain control; $4,301 becomes next objective
Catalyst of the Day: Flash PMI Wave — Europe Then the US
Wednesday’s session is sequentially driven by a full sweep of September flash PMI data — French, German, Eurozone, UK, and US figures all print within a six-hour window. For gold, the key mechanism is simple: PMI beats strengthen the economies that produce hawkish central bank expectations, lifting real yields and the dollar, both of which press against gold. Conversely, PMI misses — particularly in the US — raise the probability of rate cuts ahead, compressing yields and offering gold a bid. The most critical print is the US Flash Services PMI at 4:45 PM EST, where consensus sits at 55.8, down from 56.5 prior. A reading below 54.0 would materially shift the Fed outlook narrative. Watch for the initial reaction at the 4:45 PM EST release and the follow-through during the Barr (5:05 PM EST) and Goolsbee (7:00 PM EST) Fed speaker slots — the combination of data plus Fed commentary will define gold’s US session direction.
Fundamental Context
The macro backdrop remains structurally supportive for gold. Flash PMI data out of Australia overnight delivered a negative surprise — Manufacturing came in at 49.3 against a 52.0 forecast, and Services at 51.4 versus 53.2 expected — reinforcing the global growth softening narrative that has underpinned gold’s 2026 run. Soft manufacturing data outside the US reduces the case for coordinated global tightening and keeps the flight-to-quality case intact for gold. Japan’s bank holiday removes a significant liquidity source from Asian trading, which contributed to the thinner, choppier price action seen on the 15-minute chart overnight.
European PMI data printing Wednesday morning carries its own weight. German Manufacturing is forecast at 54.1 after 54.3, and German Services at 49.9 following 49.7 — a Services reading that slides further into contraction would raise ECB easing speculation, weakening the euro and offering a modest indirect boost to the dollar. However, gold’s correlation with EUR/USD has been secondary this week to its relationship with US real yields. The primary watch remains the US PMI figures at 4:45 PM EST: consensus of 55.8 for Services represents a notable step down from 56.5 prior, and any miss would amplify expectations for a Fed pivot — directly bullish for gold. FOMC members Barr and Goolsbee follow in the evening session; any dovish framing from either speaker would reinforce the bid under the metal.
Gold Compass Daily notes that yesterday’s session confirmed the $4,319–$4,330 zone as active demand, with price recovering from an intraday low of approximately $4,295 to close near $4,341. That recovery structure remains intact at the London open, but the pullback to $4,329 this morning represents a retest of the same zone — one the bulls need to defend to maintain the recovery narrative heading into the US session. For context on the broader week, see the Gold Week-Ahead: Sep 21–26 hub article.
Chart Analysis
The 15-minute XAU/USD chart as of 09:13 UTC+3 on September 23 shows price at $4,329.94, extending a sharp two-candle rejection lower from the $4,341–$4,353 resistance band that capped the early London session. Tuesday’s price action traced a clear W-shaped recovery from the $4,295 low, with the second peak reaching $4,372 before a measured pullback. The current move lower is testing the $4,330 horizontal level — a zone that has acted as both support and resistance multiple times across the three-day chart window. The green short-term moving average has crossed back below the orange and blue MAs, signalling near-term bearish momentum. The Bollinger Bands are contracting, consistent with reduced volatility before the PMI catalyst window. The blue longer-period MA sits near $4,337, which now acts as the first overhead hurdle. Critically, a prior dotted support line near $4,332.50 marks the base of the current consolidation — a clean break below it opens the path to $4,319 and then $4,301. The projected path on current structure is a continued retest of $4,319–$4,330 through the European morning, followed by a directional impulse in either direction triggered by the US PMI data in the afternoon. Yesterday’s recovery analysis is available in full at the Gold at $4,319 Tests Key Support article.
Bull and Bear Scenarios
Bull Scenario
Trigger: Price holds above $4,319 through the European session and US Flash Services PMI prints below 55.0 at 4:45 PM EST.
Target: Reclaim of $4,341, then extension to $4,356. A clean close above $4,356 on the 15-minute chart opens $4,372 as the next session target.
Confirmation: Dovish commentary from Barr or Goolsbee reinforces the move.
Bear Scenario
Trigger: Price breaks and closes below $4,319 on the 15-minute chart before the US PMI window, or US Flash Services PMI prints above 56.0, strengthening the dollar.
Target: $4,301, then $4,295 retest of Tuesday’s intraday low.
Confirmation: Any hawkish framing from Fed speakers Barr or Goolsbee following a strong PMI beat would validate the bear scenario.
Events Ahead — Wednesday, September 23
- 10:15 AM CET — French Flash Manufacturing & Services PMI (forecast 50.9 / 48.3): French Services in contraction raises ECB easing bets, modestly supportive for gold via yield compression.
- 10:30 AM CET — German Flash Manufacturing & Services PMI (forecast 54.1 / 49.9): Germany’s manufacturing strength contrasts with Services weakness — a split reading adds uncertainty without a clean directional signal for gold.
- 11:00 AM CET — Eurozone Flash Manufacturing & Services PMI (forecast 52.6 / 51.4): Composite figure; a miss on Services below 51.0 would be the most gold-positive outcome from the European data block.
- 11:30 AM CET — UK Flash Manufacturing & Services PMI (forecast 51.5 / 52.0): GBP reaction affects EUR/USD cross dynamics; secondary impact on gold unless the UK data moves the broader risk tone.
- 4:45 PM EST — US Flash Manufacturing & Services PMI (forecast 53.6 / 55.8): The session’s primary catalyst. A Services miss below 54.0 is gold’s clearest bull trigger of the day; a beat above 56.5 is the primary downside risk.
- 5:05 PM EST — FOMC Member Barr Speaks: Any commentary referencing rate path flexibility or economic softening would amplify gold’s reaction to the PMI data.
- 5:30 PM EST — US Crude Oil Inventories (forecast -0.7M vs -0.6M prior): Minor gold impact unless a significant surprise shifts the broad risk mood.
- 7:00 PM EST — FOMC Member Goolsbee Speaks: Second Fed speaker of the evening — watch for any divergence from Barr’s tone, which the market will interpret as a signal on internal Fed alignment.
Wednesday’s session reduces to a single execution logic: defend $4,319 through the European session, then trade the US Flash Services PMI reaction at 4:45 PM EST. A miss on Services — the most employment-sensitive PMI component — removes the primary argument for Fed patience and delivers gold’s clearest directional trade of the week.
New York Session Update
Price Check
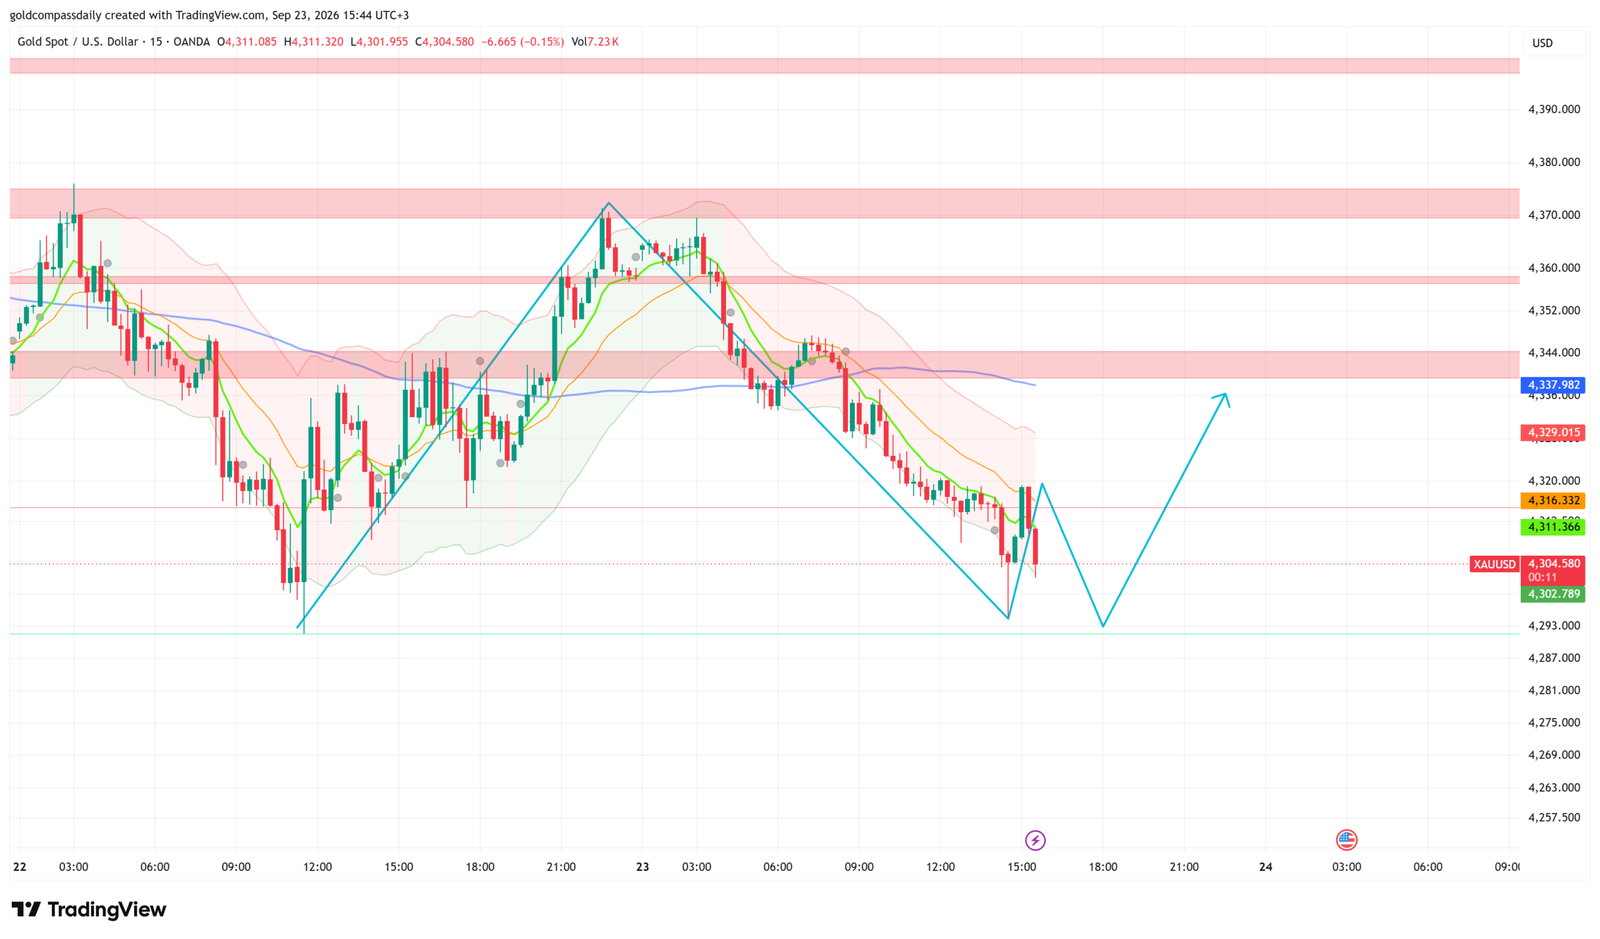
Gold has extended its morning decline to $4,304.58, breaking below the $4,319 invalidation level identified in the morning analysis and confirming the bear scenario. The cautiously bullish bias has failed — price is now trading more than $25 below the session open, with the morning’s $4,319 support now acting as overhead resistance.
What Changed
The morning thesis held $4,319 as the line separating a recovery from a deeper correction. Price broke that level decisively during the London-to-New York handover, accelerating through $4,316 and $4,311 without a sustained bounce attempt. The chart shows a clear impulsive leg lower from the $4,372 overnight high — a structured five-wave-style decline that has now reached the $4,301–$4,295 demand zone flagged as the bear target this morning. The annotated projection on the current chart suggests the analyst expects one further dip toward $4,293–$4,295 before a meaningful recovery attempt develops heading into the Asian session. All three moving averages — green, orange, and purple — are now stacked bearishly above price, confirming the trend has shifted intraday.
Updated Levels
- Current price: $4,304.58
- Bias now: Bearish intraday — morning buy bias invalidated below $4,319
- Updated support: $4,302 → $4,295 → $4,277
- Updated resistance: $4,316 → $4,329 → $4,338
- NY session target: $4,295 flush, then recovery attempt toward $4,316–$4,329 into the close
Scenarios Into the Close
Bull: Price holds above $4,295, forms a base, and reclaims $4,316 on a 15-minute close — opens a recovery toward $4,329 and potentially $4,338 ahead of the Asian open.
Bear: Price breaks $4,295 with momentum through the Goolsbee (7:00 PM EST) speaker slot — $4,277 becomes the next structural target and the session closes at a lower low.
Chart Analysis
The 15-minute chart at 15:44 UTC+3 shows XAU/USD at $4,304.58 in a sustained downtrend from the $4,372 session high reached during early Asian hours. The decline is clean and impulsive — no meaningful corrective bounces have developed, and volume (7.23K) is elevated relative to the morning session, confirming selling pressure rather than a liquidity vacuum. The annotated blue projection drawn on the chart by the analyst anticipates one final dip to approximately $4,293–$4,295 before a V-shaped recovery attempt back toward the $4,338 resistance band. The green short-term MA has rolled sharply lower and is trading well below the orange and purple MAs — all three are converging into a bearish stack. The $4,338 resistance band (pink shading) that contained price during Tuesday’s recovery now represents the ceiling for any bounce. The dotted support near $4,302 is the immediate line of defense; a 15-minute close below it confirms the path to $4,295. The chart structure is consistent with a bear flag exhaustion setup — the projected bounce is conditional, not guaranteed, and requires price to stop making lower lows at the $4,293–$4,295 zone.
New York Close & Asian Session Outlook
NY Close
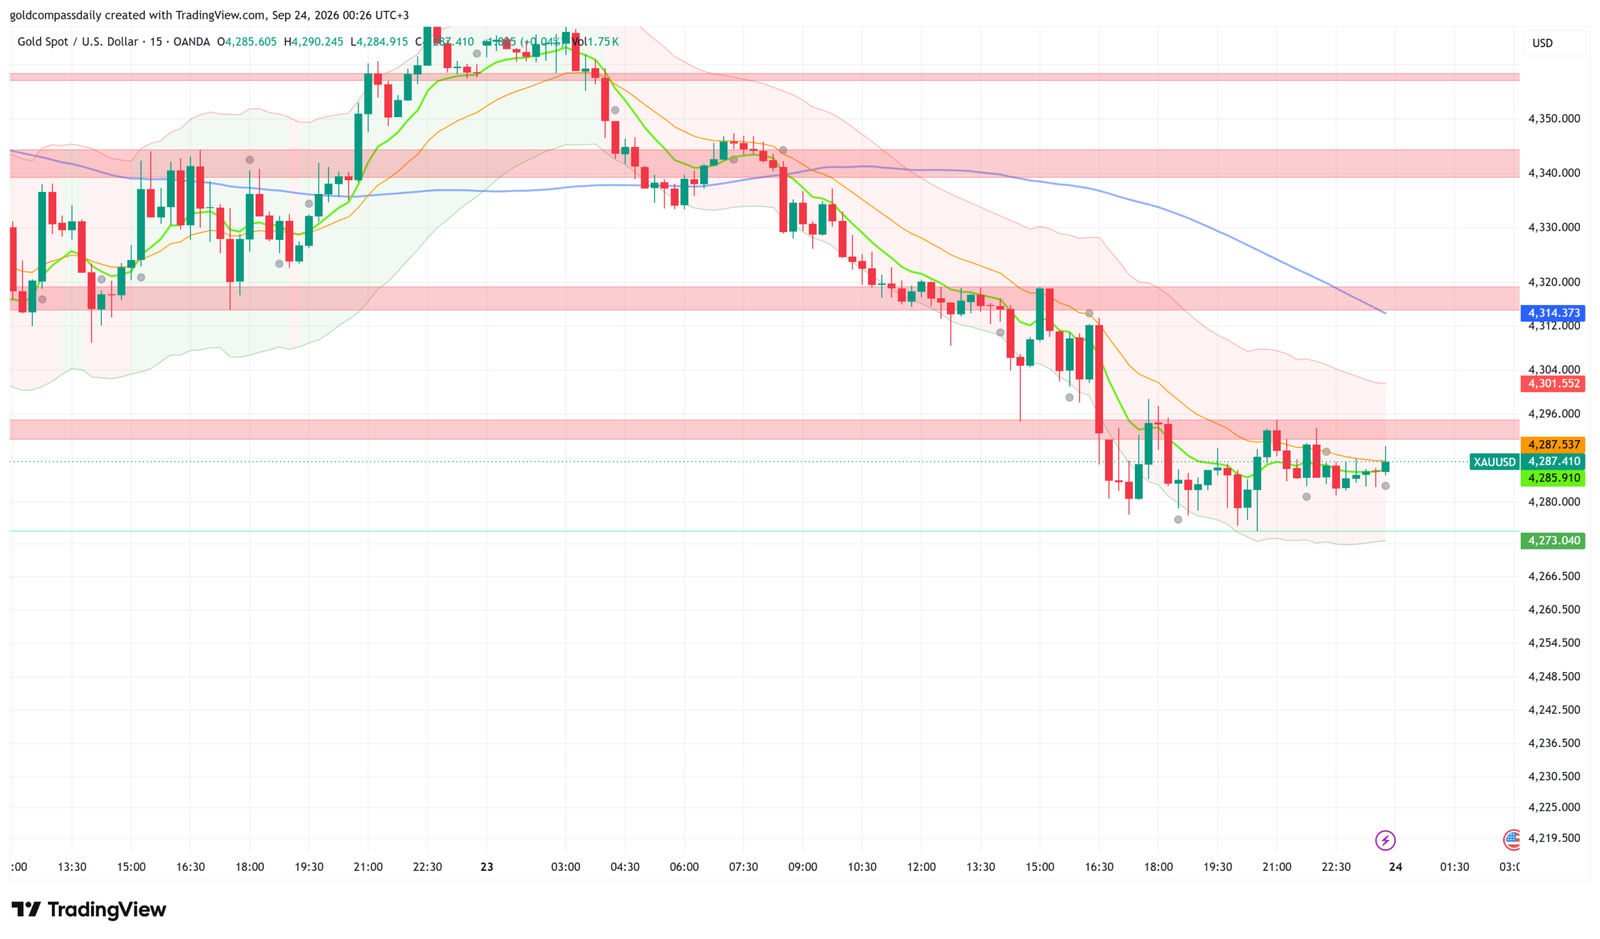
Gold closed the New York session at approximately $4,287.41 — bearish — fully invalidating Gold Compass Daily’s morning cautiously bullish thesis. The morning analysis identified $4,319 as the line separating recovery from deeper correction; price broke that level mid-session and never recovered, extending losses by a further $17 through the US afternoon to print the session’s lowest close since Tuesday’s Asian low.
Updated Key Levels
- NY Close: $4,287.41
- Session high: $4,372 (Asian hours) / Session low: ~$4,278
- Bias into Asian session: Bearish below $4,301
- Asian session support: $4,285 → $4,273
- Asian session resistance: $4,301 → $4,312
Chart Read at Close
The 15-minute chart at 00:26 UTC+3 on September 24 shows XAU/USD consolidating in a tight range between $4,280 and $4,291 after a sustained, near-uninterrupted decline from the $4,372 session high. All three moving averages — green, orange, and blue — are stacked bearishly above price and fanning out, confirming trend momentum rather than exhaustion. The Bollinger Bands have expanded significantly to the downside and price is hugging the lower band, indicating the bear move is mature but not yet showing reversal signals. The green demand zone marked on the chart sits between approximately $4,273 and $4,288, and price is currently resting on its upper boundary — this is the only structural floor visible before open air to $4,257. The closing candles in the consolidation zone are indecisive doji-type structures with small bodies, suggesting the selling impulse has temporarily stalled rather than reversed. No projected path arrow is visible on the current chart frame, but the structure implies one of two outcomes: a brief liquidity sweep of the $4,273 zone low followed by a bounce, or a sustained break lower that opens the next demand cluster near $4,257.
Asian Session Outlook
The Asian session (00:00–09:00 UTC+3) is most likely to deliver range-bound price action within the $4,273–$4,301 band, with a probable liquidity sweep of the $4,278–$4,273 lows before London opens. Japan’s market re-enters after Tuesday’s bank holiday, adding liquidity that could sharpen the initial move. The $4,301 level — Tuesday’s NY session support and today’s break point — is the level Asian bulls need to reclaim on a 15-minute close to shift the short-term structure. Absent that reclaim, the path of least resistance remains lower, and the London open becomes the next meaningful catalyst window.
Next Day Bull / Bear Scenarios
Bull trigger: Asian session holds $4,273 and price reclaims $4,301 on a 15-minute close before the London open — targets $4,312, then $4,329 on continuation through the European morning.
Bear trigger: Price breaks $4,273 on volume during Asian or early London hours — opens a move toward $4,257 and brings the broader $4,240–$4,250 weekly demand zone into play for the first time this week.
Tomorrow’s Key Events — Thursday, September 25
- 10:00 AM UTC+3 — German ifo Business Climate (forecast if available): Leading sentiment indicator for Europe’s largest economy; a miss deepens ECB easing expectations and offers modest support to gold via yield compression.
- 15:30 UTC+3 — US Initial Jobless Claims: Weekly labour market read — a print above 230K would reinforce Fed pivot expectations and give gold a bid from current depressed levels.
- 15:30 UTC+3 — US Durable Goods Orders: Weak capex demand is dollar-negative and indirectly supportive for gold; a strong beat extends today’s selling pressure.
- 17:00 UTC+3 — Fed speakers (watch for any scheduled): Any dovish pivot commentary following today’s PMI-driven selloff would be the most immediate recovery catalyst for gold heading into the weekly close.
Analysis based on the XAU/USD 15-minute chart as of September 23, 2026, 09:13 UTC+3. This article is for informational and educational purposes only and does not constitute financial advice.