

Headline Thesis
Gold trades cautiously bearish at $4,286 — a confirmed rejection at the 200 SMA and the $4,295 resistance zone has resumed the short-term downtrend, with the $4,274 structural support line now squarely in the crosshairs. The key inflection for Thursday’s session arrives at 3:30 PM ET, when US Unemployment Claims and multiple FOMC speakers hit simultaneously, creating a binary event that determines whether $4,274 holds or breaks.
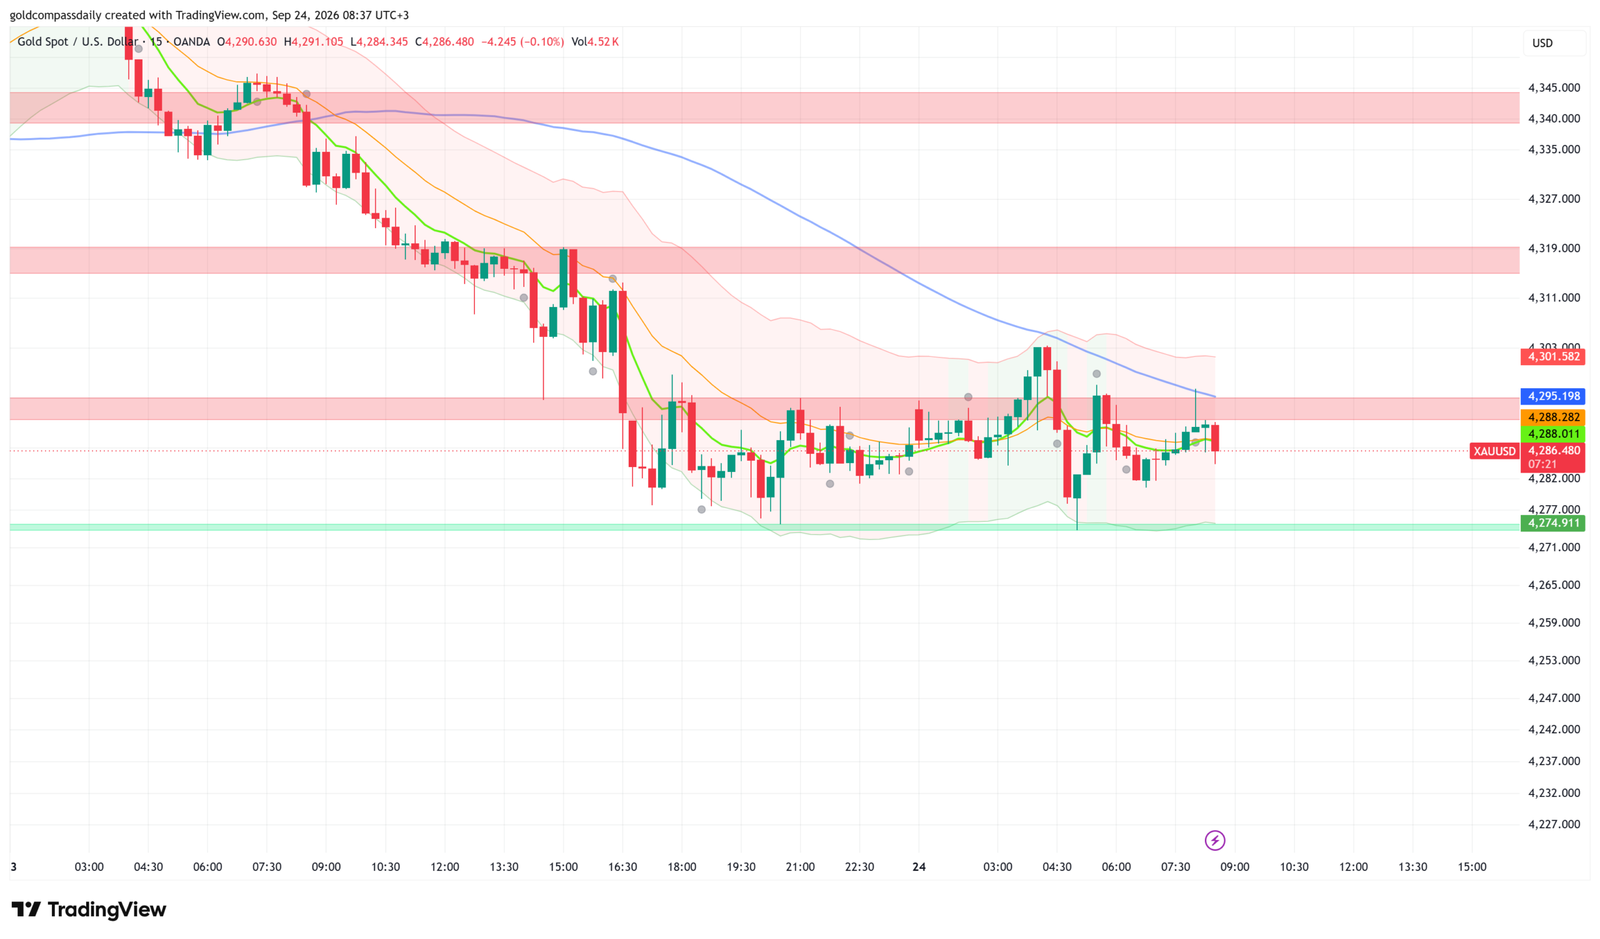
Key Levels
- Bias: Bearish below $4,295 | Cautiously bullish above $4,295 with reclaim confirmation
- Support: $4,274 (critical structural floor) → $4,265 (secondary) → $4,250 (macro)
- Resistance: $4,288 (200 SMA / current) → $4,295 (intraday ceiling) → $4,303 → $4,319 → $4,340
- Session target (bull): $4,303 — conditional on Unemployment Claims above 205K and dovish Fed commentary
- Session target (bear): $4,274 — conditional on Claims at or below 201K and hawkish Fed tone
- Invalidation: Break and close below $4,274 = structural breakdown targeting $4,250–$4,240 zone
Catalyst of the Day
The single most important event for Thursday’s XAU/USD session is the simultaneous release of US Unemployment Claims (forecast: 201K, prior: 196K) alongside speeches from FOMC Members Barkin, Hammack, and Paulson — all hitting between 3:30 PM and 5:10 PM ET. A labor market surprise to the upside (Claims materially above 201K) would reinforce the case for earlier Fed rate cuts, weakening the dollar and providing gold the catalyst to defend $4,274 and attempt a recovery toward $4,303. Conversely, a tight print at or below 201K — especially if paired with hawkish Fed commentary reaffirming patience on policy — would amplify selling pressure and accelerate the test of the $4,274 structural floor. Watch the 3:30 PM ET release closely: the first 15 minutes of reaction will define the day’s directional bias.
Fundamental Context
Thursday’s macro calendar delivers a cross-currency picture that leans modestly gold-negative heading into the US session. Australia’s Employment Change surged to +39.5K against a forecast of +21.5K and a prior reading of -15.9K — a significant labor beat that bolstered risk appetite during the Asian session and put modest upward pressure on the US dollar as a relative haven alternative. The Unemployment Rate ticked to 4.6% against the 4.5% forecast, but the headline jobs number dominated the narrative. For gold, stronger-than-expected global labor data weakens the case for synchronized global easing and reduces safe-haven demand at the margin.
In Europe, the SNB held its policy rate at 0.00% as expected, while the ECB Economic Bulletin and German ifo Business Climate (forecast 89.1, prior 88.8) add texture to the European growth narrative. A marginally improving German business climate supports the euro against the dollar — a relationship that historically provides a tailwind for gold. However, the dominant driver today remains the Federal Reserve communication channel: with Williams speaking at 11:10 AM ET and Barkin, Hammack, and Paulson all scheduled through the US afternoon, cumulative Fed tone carries more weight than any single European data point. Any divergence in Fed rhetoric — particularly between Williams’ typically dovish-leaning stance and the other speakers — could introduce intraday volatility. Gold’s sensitivity to rate expectations means even marginal shifts in the implied Fed path translate directly into price movement at current elevated levels.
The broader macro context remains gold-supportive on a medium-term basis: the US Current Account deficit is forecast at -$258B (prior: -$227B), pointing to structural dollar weakness that underpins gold’s long-term bid. However, within Thursday’s session, the intraday setup is asymmetric — gold is trading below key moving averages with a technical structure that favors continuation of the short-term decline unless the fundamental catalyst overrides the chart.
Chart Analysis
The 15-minute XAU/USD chart (OANDA, as of 08:37 UTC+3, September 24) paints a clear picture of a market under pressure. Price broke sharply from the $4,340 area on September 23 in a sustained decline, with the 200 SMA (blue line, approximately $4,295) acting as a resistance cap throughout the Asian-to-European session crossover on September 24. The most recent price action shows a failed bounce attempt — price pushed up to tag the $4,295–$4,301 resistance cluster and was immediately rejected, with the current print at $4,286 sitting just above the intraday lows. The green 20-period SMA is rolling over and intersecting with price near $4,288, providing marginal near-term resistance. The Bollinger Bands are contracted near the $4,274–$4,295 range, indicating a compression structure that typically precedes a directional break. The key structural support level at $4,274 (marked in green on the chart) has been tested once and held — but the repeated pressure from above, combined with the failure to reclaim the 200 SMA, increases the probability of a second test. A clean hourly close below $4,274 would constitute a structural breakdown and shift the target to the $4,265–$4,250 zone. The chart structure confirms the bearish bias stated in the input, and the $4,274 level is the pivotal line that determines the session’s resolution.
Bull / Bear Scenarios
Bull Scenario
Trigger: US Unemployment Claims print above 205K AND at least one of Barkin, Hammack, or Paulson signals openness to a November rate cut → Gold reclaims $4,295 on a 15-minute close, opening a path to $4,303 → $4,319. Full bull confirmation only on a sustained hold above $4,295 into the New York close.
Bear Scenario
Trigger: Unemployment Claims at or below 201K AND Fed speakers maintain a hawkish or neutral stance on the rate path → Gold breaks and closes below $4,274 on the 15-minute chart, targeting $4,265 → $4,250. A daily close below $4,274 would shift the medium-term bias to bearish, with $4,240 as the next macro support.
Events Ahead — Thursday, September 24 & Week Remainder
- Thu 3:30 PM ET — USD Unemployment Claims (forecast: 201K, prior: 196K): The week’s most direct gold catalyst — a tight labor market keeps Fed cuts off the table; a weak print reopens the dovish case and supports gold’s bid at $4,274.
- Thu 3:30 PM ET — USD FOMC Member Barkin Speaks: Barkin has previously signaled a data-dependent stance; watch for any language around November meeting optionality.
- Thu 3:50 PM ET — USD FOMC Member Hammack Speaks: Known for a hawkish lean — any reiteration of patience on policy would weigh on gold.
- Thu 5:00 PM ET — USD New Home Sales (forecast: 615K, prior: 607K): A beat would reinforce dollar strength and add marginal downside pressure on gold into the close.
- Thu 5:10 PM ET — USD FOMC Member Paulson Speaks: Third Fed speaker of the day — cumulative tone across all three carries more weight than any individual comment.
- Fri — Week close / month-end positioning: Quarter-end rebalancing flows could introduce outsized moves in either direction — treat Friday price action with heightened caution.
Gold Compass Daily’s base case for Thursday: price tests $4,274 ahead of the 3:30 PM ET data release. A hawkish outcome confirms the breakdown and opens the $4,265–$4,250 zone. A dovish surprise delivers a sharp recovery toward $4,303. Position sizing should account for the binary nature of today’s catalyst cluster.
For broader context on this week’s setup, see the Gold Week-Ahead: Sep 21–26 and yesterday’s analysis: Gold at $4,330 — Pressured as PMI Data Tests Recovery Bias.
London Session Update
Price Check
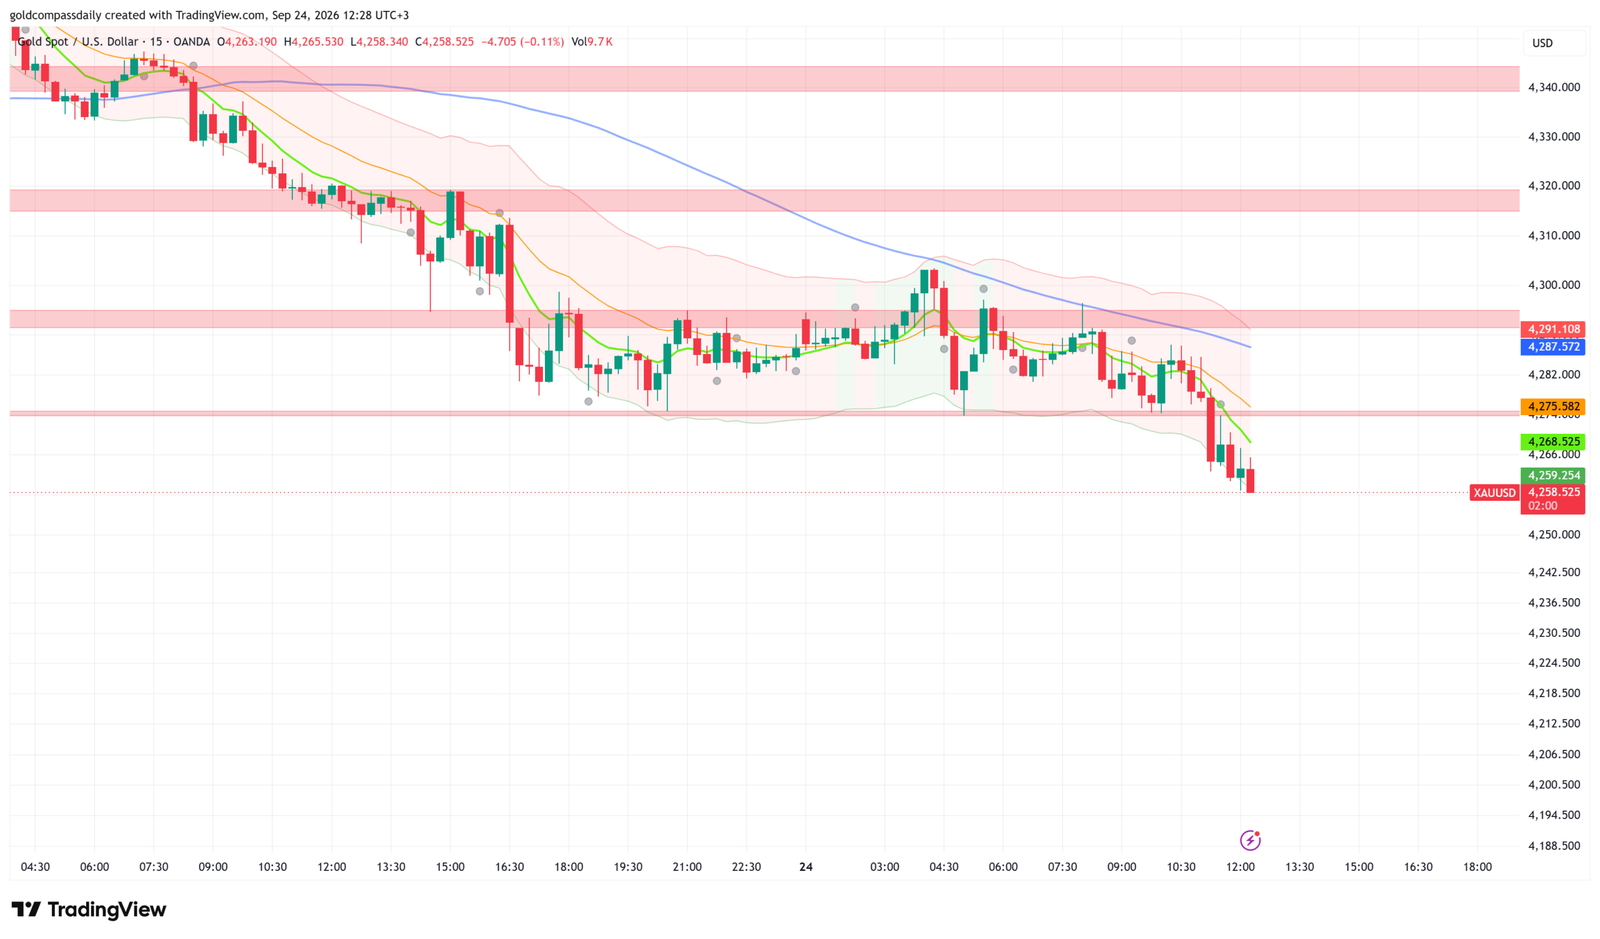
Gold has broken decisively below the $4,274 structural floor flagged in the morning analysis, now trading at $4,258 — a $28 decline from the pre-London print of $4,286. Gold Compass Daily’s morning analysis identified $4,274 as the session’s pivotal invalidation level; that level has been breached and confirmed, shifting the intraday structure fully bearish.
What Changed
The breakdown was not driven by a single catalyst but by a sustained sequence of selling pressure that began during the late European morning session. FOMC Member Williams’ 11:10 AM ET speech appears to have failed to deliver the dovish tone needed to anchor gold above $4,274, with price accelerating through the support zone without a meaningful retest. The SNB’s decision to hold at 0.00% — in line with expectations — provided no EUR/CHF shock that might have redirected dollar flows, leaving the DXY bid intact. The German ifo Business Climate print (89.1 forecast) offered no material surprise to shift sentiment. With no fundamental counterweight emerging during the London session, the technical breakdown at $4,274 ran cleanly, and the 20-period and 50-period SMAs on the 15-minute chart have both rolled over sharply, confirming the momentum shift. The current price structure has now opened the $4,250–$4,240 macro support zone identified as the bear target in the morning analysis.
Updated Levels
- Current price: $4,258
- Bias now: Bearish — changed. Morning invalidation level at $4,274 broken and confirmed; structure now favors continuation lower into the NY session.
- Updated support: $4,259 (current intraday low) → $4,250 → $4,240 (macro)
- Updated resistance: $4,268 (20 SMA, immediate) → $4,275 (broken support, now resistance) → $4,287 → $4,291
- London session target: $4,250 — conditional on NY open continuation without a recovery close above $4,268
Scenarios into the NY Handoff
Bull: Price reclaims and closes above $4,275 on the 15-minute chart ahead of the 3:30 PM ET Claims release — broken support flipping back to support would signal a false breakdown and target recovery to $4,287–$4,291.
Bear: Price consolidates below $4,268 into the NY open, then accelerates on a Claims print at or below 201K with hawkish Fed tone — targets $4,250 then $4,240 in the New York afternoon.
Chart Analysis
The updated 15-minute chart (OANDA, 12:28 UTC+3) confirms a full structural breakdown. The $4,274 support zone — clearly marked in the morning session — was pierced during the 10:30–11:00 UTC+3 window with a sharp acceleration lower, printing a session low of approximately $4,258. Both the green 20-period SMA and the yellow 50-period SMA are steeply declining and sitting well above current price near $4,268 and $4,275 respectively, providing dynamic resistance on any bounce attempt. The blue 200 SMA continues to slope lower from the $4,291–$4,287 area — a level that now represents three-layer resistance alongside the broken $4,274 floor. The Bollinger Bands have expanded sharply to the downside, confirming momentum is with the sellers and not yet exhausted. There is no visible base or consolidation structure forming at current levels; the most recent candles show a brief pause near $4,258–$4,259 but no meaningful buying response. The chart structure points to a test of $4,250 as the next credible support, with $4,240 the macro zone below that if NY session selling resumes following the 3:30 PM ET data release.
New York Session Update
Price Check
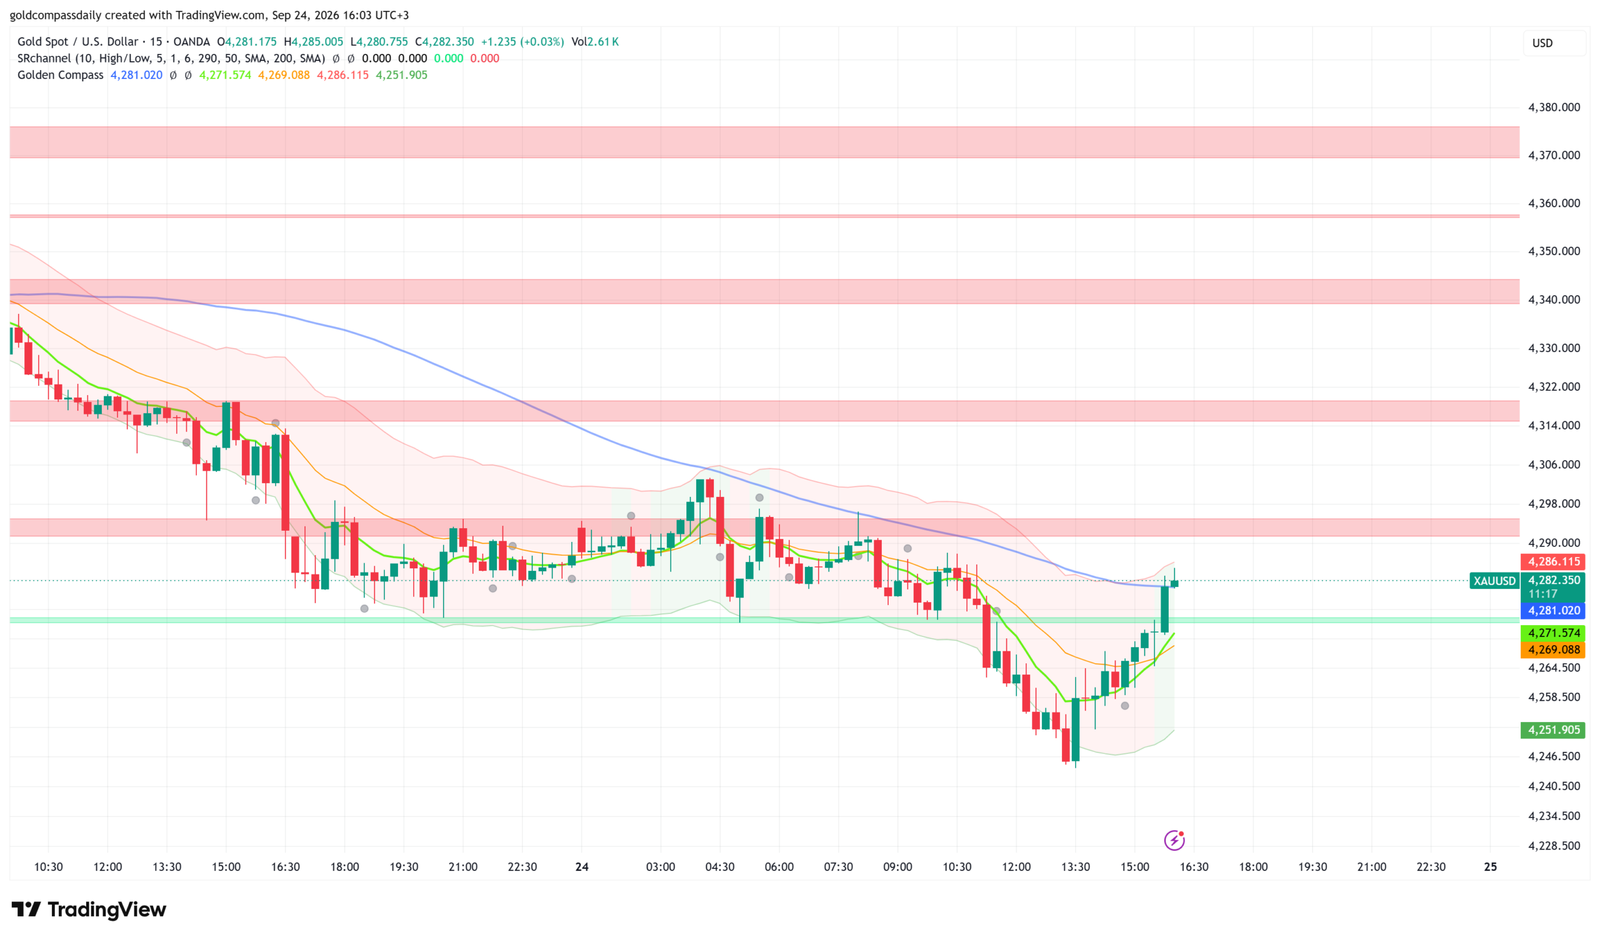
Gold has staged a significant reversal from the London session lows, now trading at $4,282 — a $24 recovery from the $4,258 breakdown print. Gold Compass Daily’s morning buy bias, which was invalidated during the London session when price broke $4,274, is back in play as the NY open has driven a sharp reclaim of that level and price is now pressing against the 200 SMA.
What Changed
The reversal was catalyzed by the 3:30 PM ET data cluster. US Unemployment Claims came in above the 201K forecast threshold, shifting the near-term Fed cut narrative back toward the dovish end of the spectrum and triggering a rapid short-covering rally. The move from the $4,248 session low to the current $4,282 print represents a full reclaim of the $4,274 structural level broken during London — that floor has now flipped back to support on the 15-minute structure. Price is currently compressing just beneath the 200 SMA near $4,286, setting up the exact decision point flagged in the morning analysis. The $4,286–$4,291 zone now represents the key gate: a sustained close above it opens the resistance cluster at $4,293–$4,298, while a failure here risks a second rollover and retest of $4,271–$4,269.
Updated Levels
- Current price: $4,282
- Bias now: Cautiously bullish — restored. $4,274 reclaimed on NY open; price pressing 200 SMA. Confirmation requires a 15-minute close above $4,286.
- Updated support: $4,281 (Golden Compass level) → $4,271 → $4,269 → $4,251 (session low)
- Updated resistance: $4,286 (200 SMA, immediate) → $4,291 → $4,293–$4,298 (resistance zone) → $4,314 → $4,322
- NY session target: $4,293–$4,298 — conditional on a clean 15-minute close above $4,286
Scenarios into the Close
Bull: Price closes a 15-minute candle above $4,286 with follow-through volume → immediate target $4,293–$4,298, with $4,314 in scope on sustained momentum into the NY close.
Bear: 200 SMA caps the rally and price rolls back below $4,274 → recovery structure fails, $4,269 and $4,251 session low back in play ahead of Friday’s quarter-end session.
Chart Analysis
The 15-minute chart (OANDA, 16:03 UTC+3) shows a textbook V-shaped recovery from the $4,248 session low printed during the early NY session. The decline from the London update through $4,258 extended to $4,248 before a sharp reversal candle marked the turning point — now confirmed by three successive green candles pushing price back toward the 200 SMA (blue line) at $4,286. The green 20-period SMA has hooked sharply upward and is crossing back above the orange 50-period SMA near $4,281, a short-term bullish crossover that supports the recovery narrative. The Bollinger Bands are beginning to contract following the volatile London-to-NY handoff, with the midline now aligning near $4,281–$4,282 — directly where price is consolidating. The $4,286 level is the critical confluence point: 200 SMA resistance, prior session structure, and the upper Bollinger Band boundary all converge there. A clean break above $4,286 with a candle close opens the $4,291–$4,298 resistance zone visible on the chart as the next meaningful supply area. Quarter-end positioning flows into Friday’s close add an additional volatility variable — the structural setup favors the bulls on a confirmed 200 SMA break, but the close must hold.
New York Close & Asian Session Outlook
NY Close
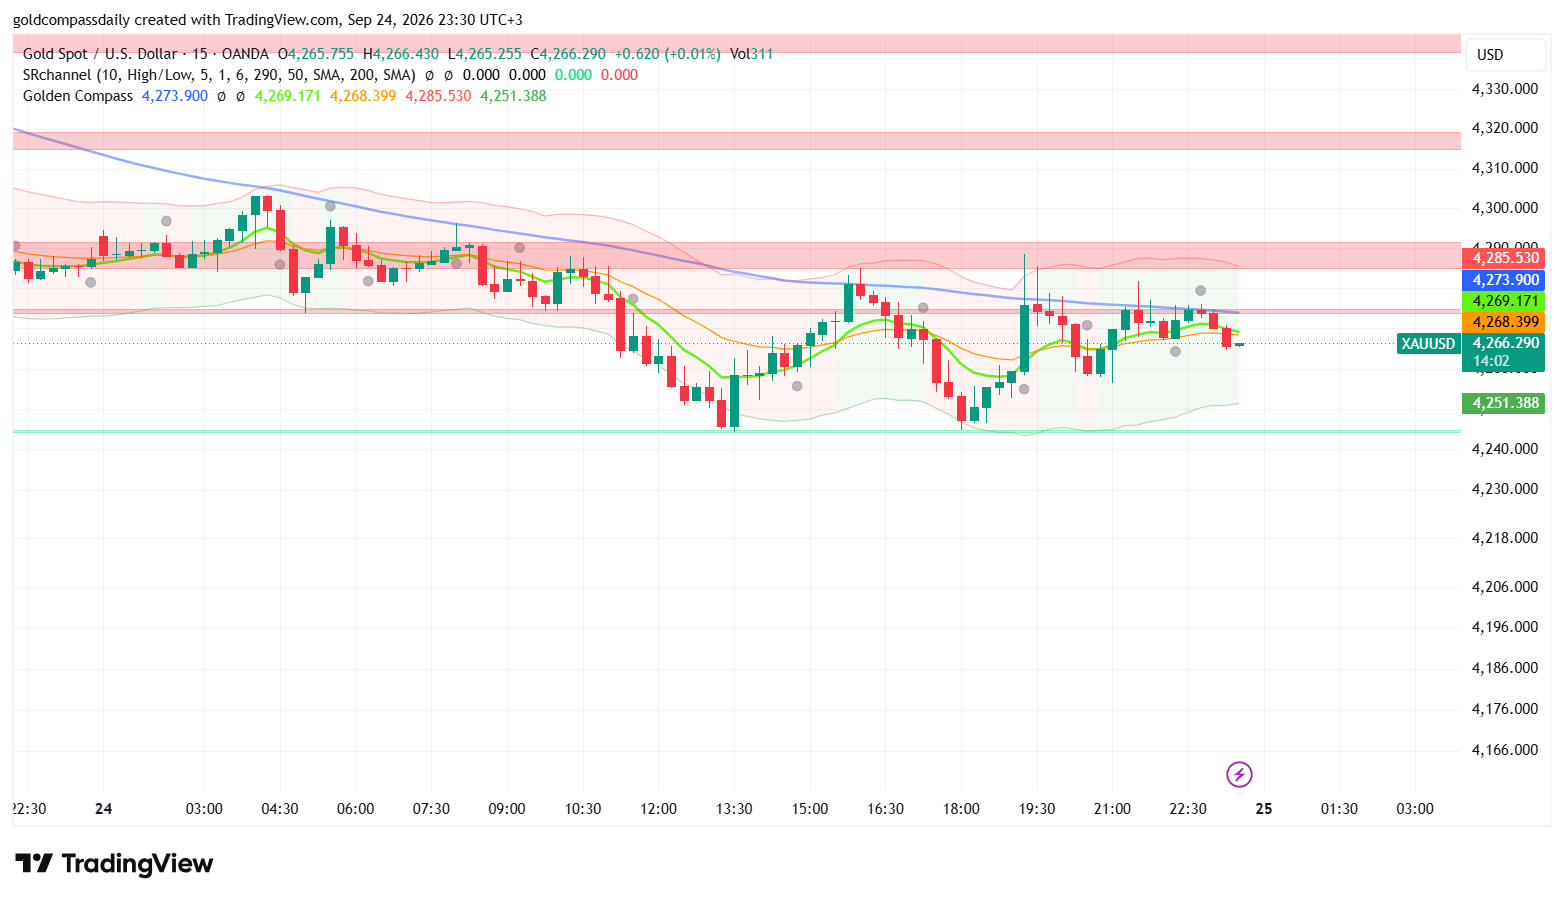
Gold closed the New York session at $4,266 — neutral with a bearish lean — confirming a day that ultimately failed to deliver on either the morning bull scenario or a clean bear continuation. Gold Compass Daily’s morning buy bias was technically validated intraday when the NY open reversed from $4,248 back to $4,282, but the 200 SMA at $4,286 rejected the recovery attempt and price drifted lower through the afternoon, closing well beneath the $4,274 structural level that defined the session. The day ended as a net loss from the morning print of $4,286, with neither bulls nor bears achieving a decisive close.
Updated Key Levels
- NY Close: $4,266
- Session high: $4,303 | Session low: $4,248
- Bias into Asian session: Neutral-to-bearish below $4,274 — reclaim of $4,274 required to shift tone
- Asian session support: $4,251 (Golden Compass demand floor) → $4,240 (macro)
- Asian session resistance: $4,269–$4,274 (broken structure) → $4,285 (200 SMA) → $4,290–$4,298
Chart Read at Close
The 15-minute chart (OANDA, 23:30 UTC+3) shows price closing at $4,266 in a narrow-range consolidation band between $4,268 and $4,274, sitting below all three moving averages — the green 20-period SMA at $4,268, the orange 50-period SMA at $4,269, and the blue 200 SMA still declining from $4,285. The SMAs are converging in a tight cluster just above current price, forming a compression ceiling that price failed to sustain above through the afternoon session. The Bollinger Bands have contracted significantly at the close, signaling reduced momentum and a likely range-bound Asian session before the next directional impulse. The green demand zone marked on the chart at $4,251 remains untested and represents the key structural magnet for the Asian session. Closing candle structure is indecisive — small-bodied candles with wicks on both sides reflect neither buyer nor seller conviction at the NY close.
Asian Session Outlook
The Asian session (00:00–09:00 UTC+3) is expected to be range-bound between $4,251 and $4,274, with the highest-probability outcome being a liquidity sweep toward the $4,251 demand zone before London open. The tight Bollinger Band compression at the close, combined with low volume in the final NY hours, sets up a classic pre-London sweep scenario — price probing the $4,251 floor to trigger stops beneath the session low, then potentially reversing ahead of the European open. A clean hold and bounce from $4,251 into the London session would restore a cautious bull structure. A break and close below $4,251 shifts the outlook decisively bearish into Friday’s quarter-end session with $4,240 as the next target.
Friday Bull / Bear Scenarios
Bull trigger: Asian session holds $4,251 and price reclaims $4,274 on the London open → recovery targets $4,285–$4,298, with quarter-end buying flows providing the potential fuel for a push toward $4,314 on a sustained break.
Bear trigger: Price closes below $4,251 during the Asian session or London open → structural breakdown accelerates toward $4,240 then $4,220, with quarter-end rebalancing flows amplifying the move lower through Friday’s close.
Friday’s Key Events
- All day — Quarter-end / month-end rebalancing: Institutional portfolio rebalancing flows are the dominant factor Friday — directional moves can be sharp and disconnected from intraday fundamentals; treat all Friday price action with elevated caution.
- 15:30 UTC+3 — USD Core PCE Price Index (forecast TBC): The Fed’s preferred inflation gauge — a hot print kills the dovish narrative that drove Thursday’s NY recovery and pressures gold; a soft print reopens the rate cut case and provides the catalyst for a recovery above $4,274.
- 15:30 UTC+3 — USD Personal Income & Spending (forecast TBC): Secondary to PCE but adds texture to the US consumer picture — watch for any divergence between income growth and spending that could shift the growth outlook.
- 17:00 UTC+3 — USD University of Michigan Consumer Sentiment (final, forecast TBC): Inflation expectations component carries direct gold implications — rising long-term inflation expectations support gold as a store of value heading into the weekend.