

Gold trades cautiously bullish at $4,191 — a V-shaped recovery from the $4,139 Asian-session low has reclaimed the 200-period moving average, and the $4,173 area now acts as the line separating buyers from sellers. The next test comes at 5:00pm (UTC+3), when the ISM Manufacturing PMI and its prices-paid component land alongside a Fed speaker. Gold Compass Daily reports that the bounce is constructive but extended after a $52 climb in roughly five hours.
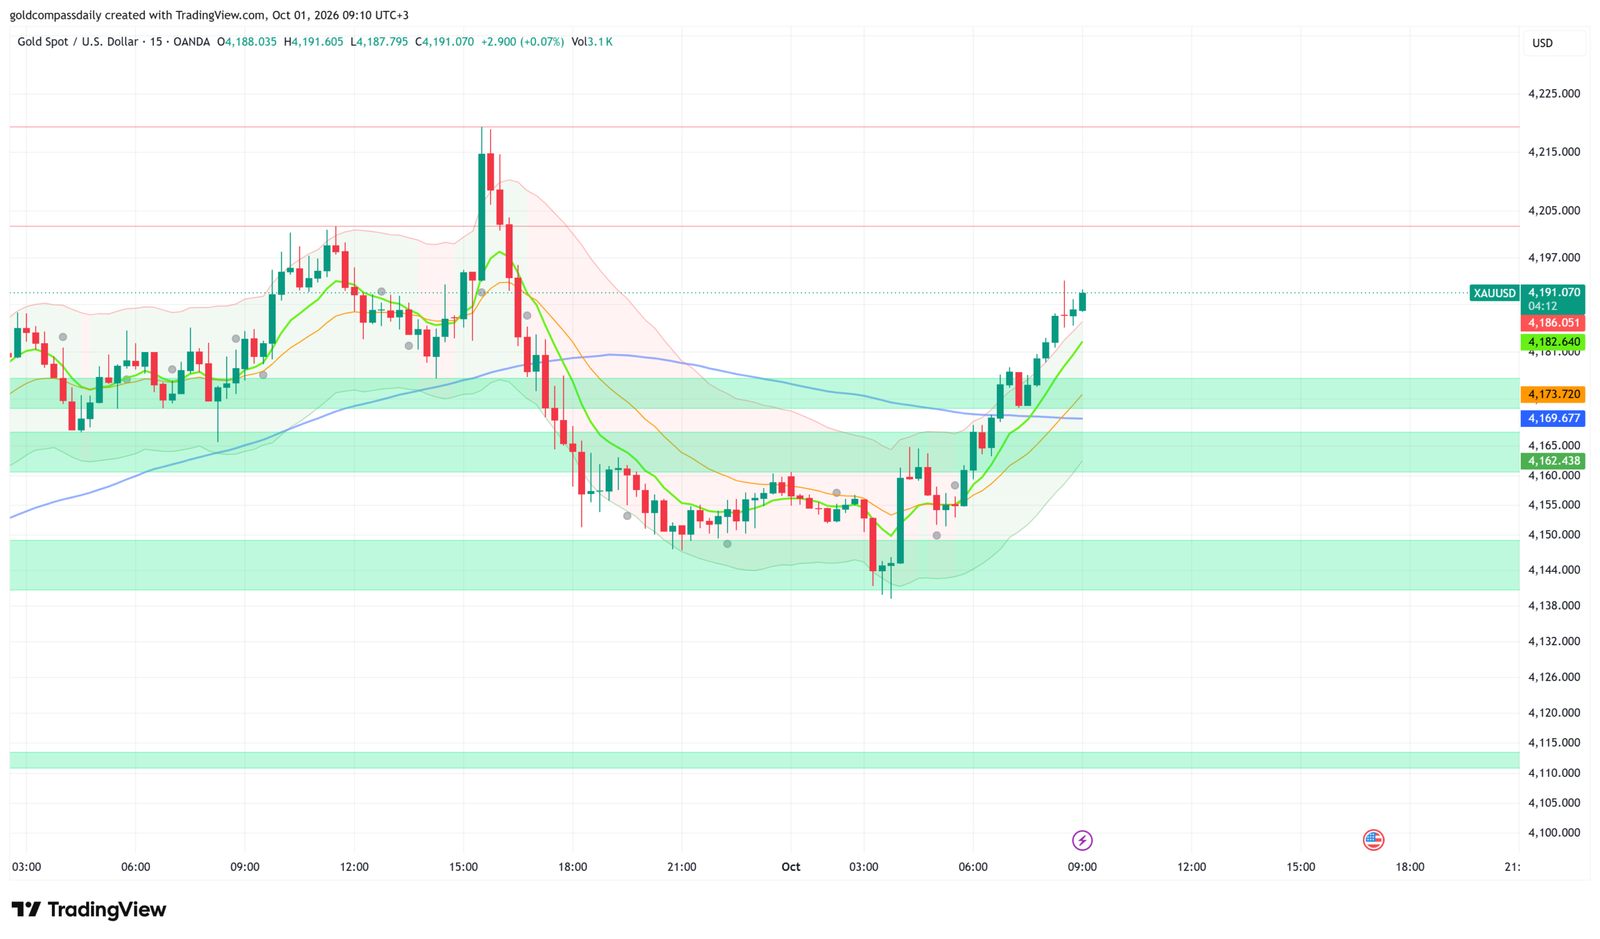
Key Levels
- Bias: Cautiously Bullish above $4,173
- Support: $4,182 → $4,173 → $4,162
- Resistance: $4,197 → $4,202 → $4,220
- Session target: $4,202 (conditional on the ISM data failing to lift yields)
- Invalidation: Below $4,162 = the recovery has failed and the $4,141–$4,149 demand zone is back in play
Catalyst of the Day: ISM Manufacturing PMI
The ISM Manufacturing PMI is the priority for today’s session because it carries both a growth reading and an inflation reading in one release. Consensus sits at 54.8 against 54.6 previously, which points to a manufacturing sector still expanding at a healthy clip. The detail that matters more for gold is ISM Manufacturing Prices, forecast at 72.9 against 71.1 before. A reading that high signals that input-cost pressure is still building, and that feeds directly into the debate over whether the Fed needs to stay restrictive. Higher rate expectations lift Treasury yields and the dollar, and both raise the opportunity cost of holding non-yielding gold. The release is due at 5:00pm (UTC+3), the same minute FOMC member Waller is scheduled to speak. Watch the prices-paid figure first: a print at or below 71 would ease the pressure on yields and favor a push toward $4,202, while a print above 73 would put the $4,173 support under immediate test.
Fundamental Context
The week is built around the Fed’s path and Friday’s labor data, as laid out in the Gold Week Ahead: NFP and the Fed Rate Hike Test hub. Yesterday’s session, covered in Gold Cautiously Bullish at $4,175: Core PCE in Focus, produced a spike to $4,220 during the US data window that was fully reversed within hours, with price sliding to the $4,148 area by the evening. That reversal shows that sellers still defend the upper end of the range whenever yields firm, which is why the recovery today is treated as cautiously bullish rather than a trend change.
The US labor calendar is the second driver. Weekly Unemployment Claims are forecast at 201K against 197K previously, and the Challenger Job Cuts figure, which stood at -38.5% year-on-year last time, arrives at 12:30pm (UTC+3). A rise in claims toward forecast would be a first sign of labor-market cooling, which supports gold by weakening the case for further tightening ahead of Friday’s payrolls. A claims print well below 197K would do the opposite and strengthen the dollar.
Central bank rhetoric is the third driver. Nine FOMC members are scheduled to speak today, including Waller, Jefferson, Bowman and Cook later in the session, while Lagarde (4:30pm) and BoE Governor Bailey (11:00am) add to the policy noise. For gold, the relevant question is whether the Fed speakers lean toward holding or tightening: hawkish language from several of them in the same session would cap rallies, while a cautious tone would help the $4,182 level hold on dips. Overnight data from Asia was mixed and had little direct impact. Japan’s Tankan Manufacturing Index came in at 24 against a forecast of 25, and the Final Manufacturing PMI was unchanged at 54.1. Gold’s recovery began before any of those releases, which points to dip-buying at the $4,141–$4,149 demand zone rather than a data-driven move.
Chart Analysis
The 15-minute XAU/USD chart shows gold at $4,191.07, up 0.07% on the latest candle after a sharp reversal from the $4,139 low at around 03:40 (UTC+3). That low swept the $4,141–$4,149 demand zone, and buyers then drove price back through the $4,160–$4,166 and $4,170–$4,177 zones in a single move, reclaiming the 200-period moving average near $4,169.7 at about 06:15. The short-term moving averages are stacked bullishly, with the fast average at $4,182.6 above the slower one at $4,173.7, and both are rising beneath price, so the first area where dip-buyers are likely to step in is $4,182. Price is trading above the upper volatility band near $4,186, which marks the move as extended and leaves it vulnerable to a pullback toward the fast average before any continuation. The 08:45 candle printed a wick up to roughly $4,196, which defines near-term resistance at $4,197. Above that, the horizontal resistance lines sit at $4,202, the level that capped yesterday’s morning advance, and at $4,220, yesterday’s spike high. No unfilled gaps are visible on the 15-minute timeframe. The projected path is a consolidation between $4,182 and $4,197 into the ISM release, followed by a directional break. The $4,220 level mentioned in the desk’s outlook remains the extended upside objective, but it requires a clean break of $4,202 first, so $4,202 is set as the session target.
Bull and Bear Scenarios
Bull trigger: A 15-minute close above $4,197 after the ISM release, with prices-paid at or below 71 and price holding above $4,182 → $4,202, then $4,220 on a confirmed break.
Bear trigger: ISM Manufacturing Prices above 73 together with a 15-minute close below $4,173 → $4,162 first; a close below $4,162 opens the $4,149–$4,141 zone and the $4,139 session low.
Events Ahead
- Thu 12:30pm (UTC+3) — Challenger Job Cuts y/y (previous -38.5%): early read on labor demand that shapes expectations for Friday’s payrolls.
- Thu 3:30pm — Unemployment Claims (201K): a figure above forecast supports gold, a figure below 197K supports the dollar.
- Thu 4:30pm — ECB President Lagarde speaks: a hawkish tone lifts the euro and weakens the dollar, which is mildly supportive for gold.
- Thu 5:00pm — ISM Manufacturing PMI (54.8) and ISM Prices (72.9), plus Waller speaks: the day’s main catalyst for yields and the dollar.
- Thu 8:30pm / 10:00pm / 10:30pm — Jefferson, Bowman and Cook speak (no forecast): the tone of the policy messaging decides whether the US-session gains hold into the Asian open.
- Fri — Non-Farm Payrolls: the week’s final test of the Fed rate-path debate, covered in the weekly hub.
The actionable read for the session is simple: while $4,173 holds, dips toward $4,182 are the preferred entry zone with a target at $4,202. A 15-minute close below $4,173 after the ISM release cancels that approach and moves the focus to $4,162.
New York Session Update
Gold trades at $4,178, still inside the range and above the $4,173 support that anchored Gold Compass Daily’s morning analysis. The cautiously bullish bias survived, but with less conviction: the midday sell-off pushed price below the $4,162 invalidation level before buyers recovered it.
What Changed
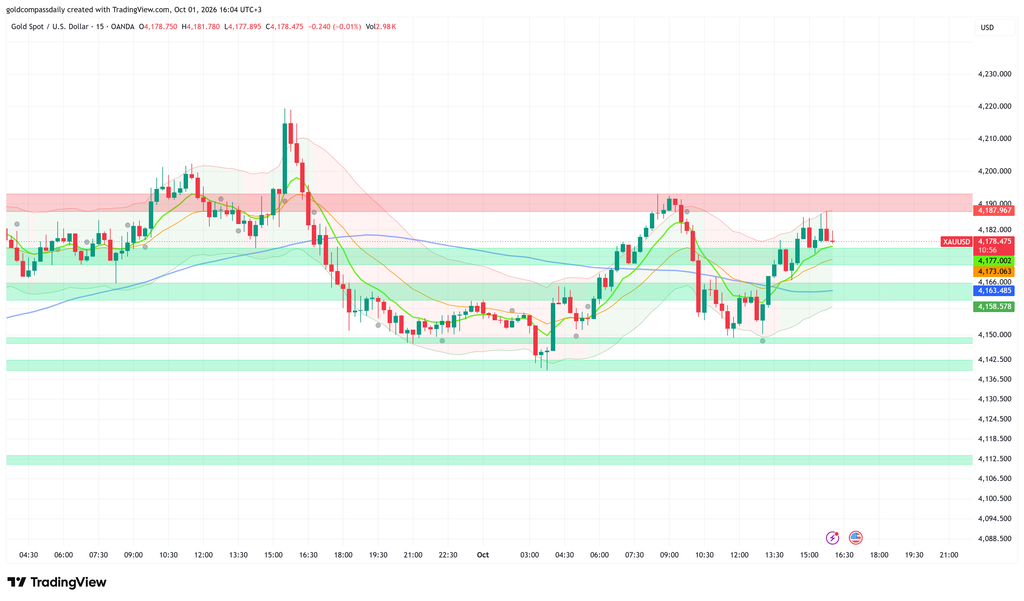
The morning analysis projected a consolidation between $4,182 and $4,197 ahead of the ISM release, and that range did not hold. Gold rejected from the $4,193 area around 09:00 (UTC+3) and sold off sharply through the London session, dropping to roughly $4,149 around midday. That low sat inside the $4,141–$4,149 demand zone flagged in the morning piece, and it is where dip-buyers stepped in. The recovery since has been steady, taking price back to $4,187 before it stalled, and spot now sits near the morning’s trading levels. The recovered low at $4,149 is a higher low than the $4,139 Asian-session low, which keeps the broader recovery structure intact. Price action has stayed hesitant ahead of the US open. The ISM Manufacturing PMI and the prices-paid component are still due at 5:00pm (UTC+3), alongside Waller, so the main event risk of the session has not yet been priced.
Updated Levels
- Current price: $4,178
- Bias now: Cautiously Bullish, unchanged but with reduced conviction. The $4,162 invalidation was breached intraday and reclaimed, so the bias now depends on holding $4,173.
- Updated support: $4,173 → $4,163 → $4,149
- Updated resistance: $4,188 → $4,193 → $4,202
- NY session target: $4,193 (conditional on a 15-minute close above $4,188)
Scenarios Into the Close
Bull: A 15-minute close above $4,188 after the ISM release → $4,193, then $4,202 on a confirmed break.
Bear: A 15-minute close below $4,173 → $4,163; a close below $4,163 reopens $4,149 and the $4,141–$4,149 demand zone.
Chart Analysis
The 15-minute XAU/USD chart shows gold at $4,178.48, consolidating between the $4,149 midday low and the $4,193 morning high, with a bullish tilt after a V-shaped recovery from the lows. Price is compressing beneath a supply zone at $4,187–$4,193, where two upper wicks around 15:15 and 15:45 (UTC+3) show sellers defending the zone, and the upper volatility band at $4,188 sits at the same level and reinforces it. The moving averages remain in bullish order: the fast average at $4,177.0 is above the slower one at $4,173.1, and both sit above the 200-period average at $4,163.5, which has flattened. Price is hugging the fast average, which signals balance rather than momentum. Demand zones are visible at $4,170–$4,177, $4,158–$4,166 and $4,141–$4,149, with a deeper zone near $4,111–$4,113. No unfilled gaps are visible. The projected path is a consolidation between $4,173 and $4,188 into the 5:00pm ISM release, followed by a directional break. The structure favors the upside only on a close above $4,188; a close below $4,173 would shift the near-term balance to sellers.
New York Close & Asian Session Outlook
Gold closed the New York session at $4,175 — neutral with a constructive tilt — and the morning bias was only partly confirmed. Gold Compass Daily’s morning analysis projected consolidation between $4,182 and $4,197 with $4,173 as the line for buyers. Price instead dropped through the $4,162 invalidation to $4,149 before recovering and closing back above $4,173.
Updated Key Levels
- NY close: $4,175
- Session high / low: $4,193 / $4,139 (the New York session itself traded $4,187 / $4,150)
- Bias into Asian session: Cautiously Bullish above $4,168, Neutral below
- Asian session support: $4,168 → $4,158
- Asian session resistance: $4,187 → $4,193
Chart Read at Close
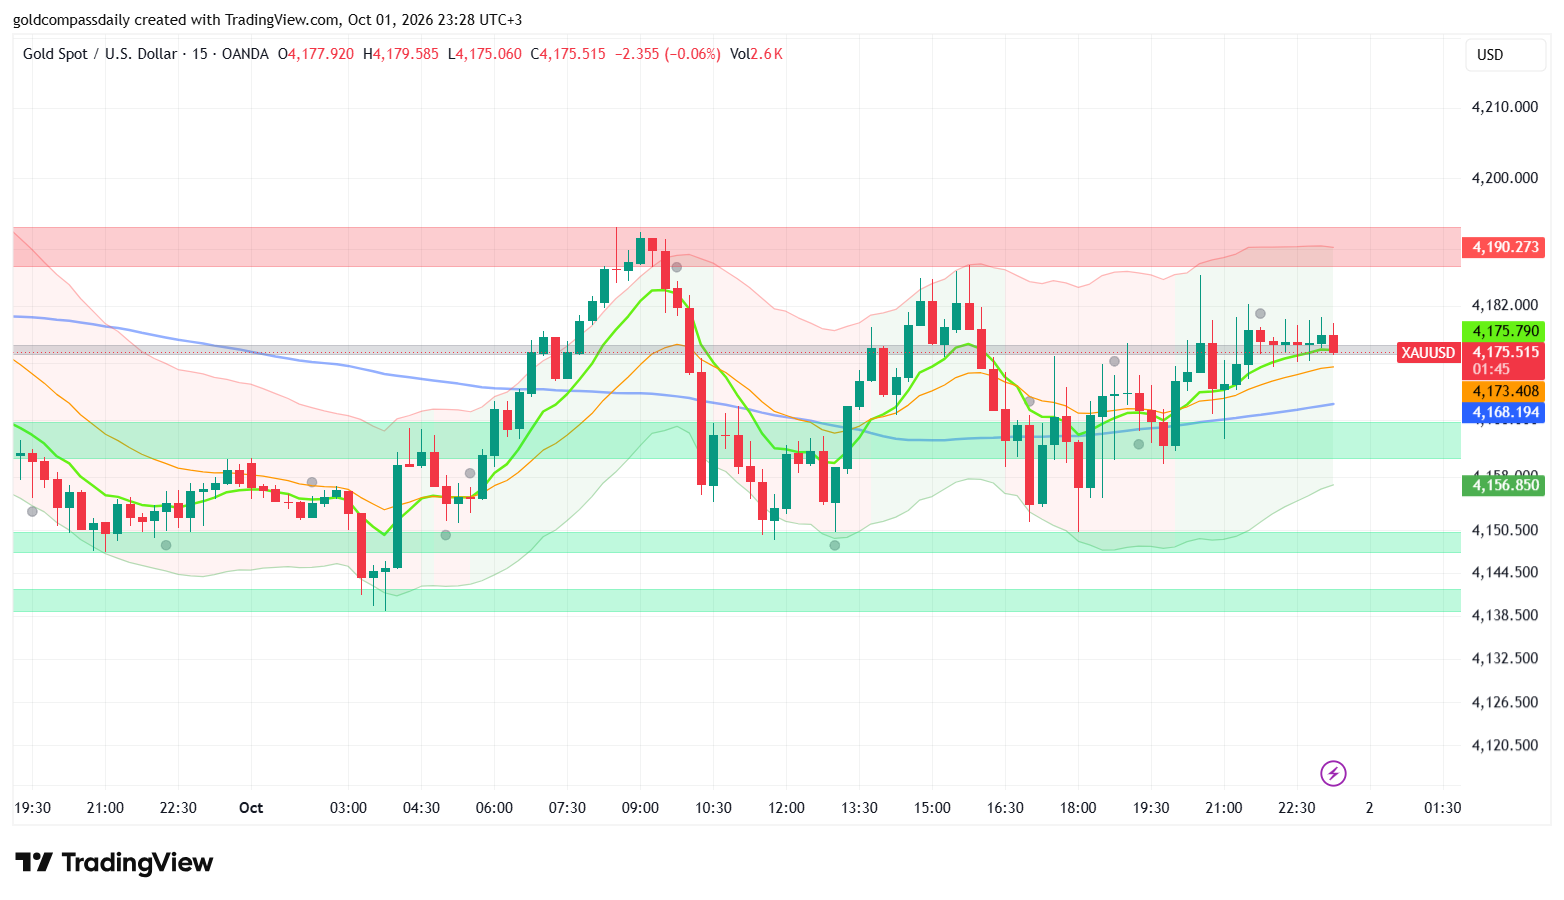
Gold sits at the centre of its range, with price at $4,175.5 just below the fast moving average at $4,175.8 and above the slower average at $4,173.4. The 200-period average at $4,168.2 is the base of that structure, and the $4,158–$4,167 demand zone sits beneath it. Price is mid-band, between the lower band at $4,156.9 and the upper band at $4,190.3, so there is no volatility extreme in either direction. The closing candle is a small red body with wicks on both sides, which indicates balance rather than seller or buyer control. No projected path arrow is drawn, so the reading rests on structure alone, which favors range trade with a mild upward lean, in line with the expectation of a recovery.
Asian Session Outlook
Ahead of Friday’s payrolls, the Asian session (00:00–09:00 UTC+3) is likely to stay range-bound between $4,168 and $4,187. The most probable test is $4,168, where the 200-period average and the top of the demand zone converge. A brief sweep of the $4,150 New York low is possible before the London open, but it would need a close below $4,158 to change the picture.
Next Day Bull / Bear Scenarios
Bull trigger: Non-Farm Payrolls below 89K with unemployment above 4.1%, and price holding above $4,175 → $4,187, then $4,193 on a confirmed break.
Bear trigger: Payrolls above 89K with hourly earnings above 0.3%, and a close below $4,168 → $4,158, then $4,150.
Tomorrow’s Key Events
- 1:45am — FOMC member Logan speaks: a hawkish tone sets the dollar’s direction before payrolls.
- 2:30am — Tokyo Core CPI y/y (2.4% vs 1.8% prior): a rising reading supports the case for Bank of Japan tightening and a weaker dollar.
- 12:00pm — Eurozone CPI Flash y/y (3.7% vs 3.2%) and Core CPI (2.5% vs 2.4%): firmer inflation lifts the euro against the dollar.
- 3:30pm — Non-Farm Payrolls (89K vs 162K), Unemployment Rate (4.1%), Average Hourly Earnings (0.3%): the week’s main catalyst for Fed expectations and yields.
- 5:00pm — Factory Orders m/m (0.1% vs 0.9%) and Logan again: second-tier data and Fed commentary after the payrolls reaction.
Analysis based on the XAU/USD 15-minute chart as of October 1, 2026, 09:10 (UTC+3). This article is for informational and educational purposes only and does not constitute financial advice.