

Gold trades cautiously bullish at $4,175 — the metal has recovered roughly $40 from yesterday’s neutral read and now sits on a rising moving average, with US Core PCE due this afternoon as the test of whether buyers can hold it. Gold Compass Daily reports that the bias stays constructive while price holds above $4,164.
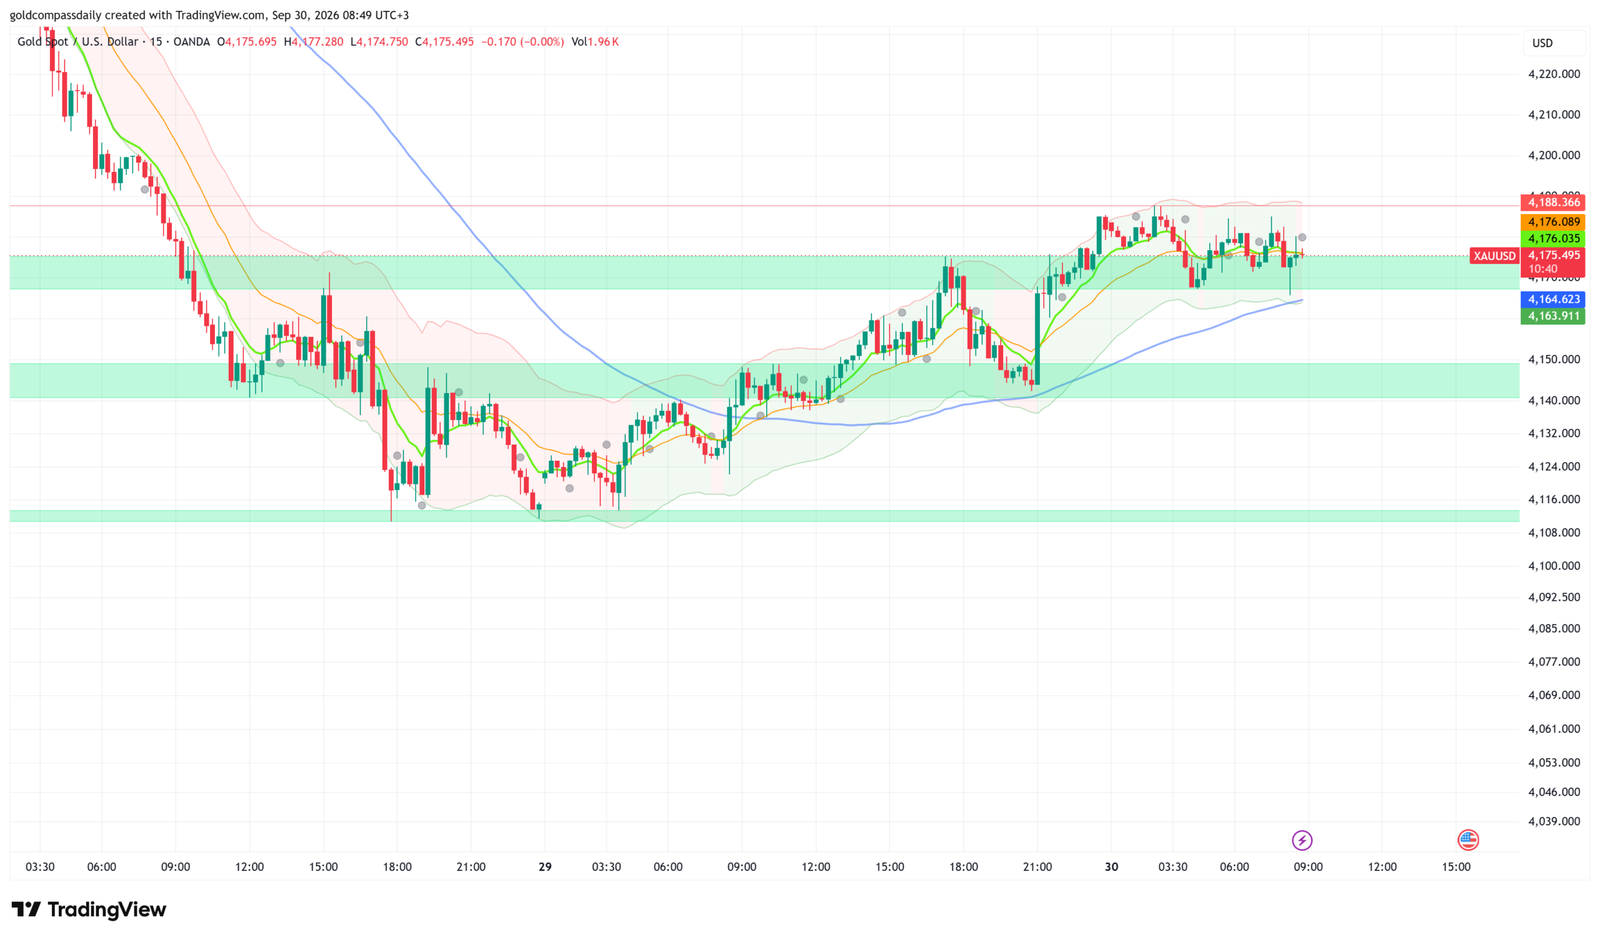
Key Levels
- Bias: Bullish above $4,164, neutral below
- Support: $4,164 → $4,149 → $4,141
- Resistance: $4,188 → $4,200 → $4,210
- Session target: $4,188 (conditional on Core PCE printing at or below the 0.3% forecast)
- Invalidation: Below $4,164 = buyers have lost the rising moving average and the $4,149–$4,141 zone comes back into play
Catalyst of the Day: US Core PCE
The Core PCE Price Index is the Federal Reserve’s preferred inflation gauge, and it lands while markets are debating whether the Fed can stay on hold or must tighten further. Gold pays no yield, so any inflation surprise that pushes rate expectations and Treasury yields higher tends to weigh on it. The forecast is 0.3% m/m against 0.2% previously. A print at 0.3% or lower keeps the recovery intact. A reading of 0.4% or higher would strengthen the rate-hike case and puts the $4,164 support to a direct test. The release comes at 15:30 UTC+3, fifteen minutes after ADP Non-Farm Employment (forecast 73K, previous 38K), so the two prints will hit the market almost back to back. Watch the first five-minute reaction for direction and the following 15-minute close for confirmation.
Fundamental Context
Overnight data was mixed but leaned soft in Asia. Japan’s preliminary industrial production fell 1.7% m/m against a forecast rise of 1.4%, and retail sales growth slowed to 2.7% y/y from 3.7%. Weaker Japanese activity feeds into lower global growth expectations, which usually supports haven demand. In Australia, headline CPI cooled to 4.0% y/y from 3.5% expected… in fact came in slightly under the 4.1% forecast, while trimmed mean CPI held at 0.2% m/m versus 0.3% expected. Inflation remains high but the miss reduces pressure on other central banks to tighten aggressively, a modest positive for gold.
China’s data offered a supportive tone for physical demand sentiment. The official non-manufacturing PMI rose to 50.2 against a 49.2 forecast, and the manufacturing PMI held at 50.1. China is one of the largest gold-consuming economies, so stabilising activity helps the demand outlook beneath the market.
The US side carries the risk. Personal spending is forecast at 0.8% m/m against 0.2% previously, and the final GDP price index is expected at 6.4% q/q. Strong consumption and stubborn price growth argue for a firmer Fed, which is the main headwind against a move through $4,188. Two Fed speakers, Barkin (20:30) and Cook (22:25), plus President Trump (22:30), follow after the data, so the late session can reprice whatever the afternoon decides. Yesterday’s session is covered in Gold Neutral at $4,135: JOLTS, Fed Speakers Test $4,117, and the wider week is mapped in the Gold Week Ahead: NFP and the Fed Rate Hike Test.
Chart Analysis
The 15-minute chart shows a clear structural shift. The sell-off from above $4,200 into the $4,111 low on September 29 has been followed by a staircase of higher lows, and price now consolidates at $4,175 inside a tight $4,164–$4,188 range. The 200-period moving average is rising and sits at $4,164.6, directly under the demand zone that spans roughly $4,165–$4,175, and a wick into that area this morning was bought immediately. The short-term moving averages are flat and converge at $4,176, so price is sitting on them with no directional momentum, which points to a coiled market waiting for the data. The upper band and session high near $4,188 caps every rally attempt since yesterday evening. Below, the $4,141–$4,149 zone is the next structural support, followed by the $4,111 base. The projected path is a hold above $4,164 into the US data, then a retest of $4,188. A 15-minute close above that level opens $4,200. Levels are confirmed, with one adjustment: the moving average that supports price on this chart is the 200-period line at $4,164.6, and the demand zone is $4,165–$4,175 rather than a single $4,174 level.
Bull / Bear Scenarios
Bull trigger: Core PCE at or below 0.3% with price holding above $4,164, followed by a 15-minute close above $4,188 → $4,200, with $4,210 as the extension.
Bear trigger: Core PCE at 0.4% or higher and a 15-minute close below $4,164 → $4,149, then $4,141. A break under $4,141 exposes the $4,111 low.
Events Ahead
- Wed 15:15 — US ADP Non-Farm Employment (73K): a strong print lifts yields and challenges the $4,164 support.
- Wed 15:30 — US Core PCE m/m (0.3%): the primary catalyst for today’s session and Fed rate expectations.
- Wed 15:30 — US Personal Spending m/m (0.8%): strong spending adds to the case for a firmer Fed.
- Wed 16:45 — US Chicago PMI (51.2): a regional read on activity that can add to dollar moves after PCE.
- Wed 17:30 — US Crude Oil Inventories (-0.7M): energy moves feed into inflation expectations.
- Wed 20:30 and 22:25 — FOMC Members Barkin and Cook speak: any hawkish tilt on hikes is the late-session risk for gold.
- Wed 22:30 — President Trump speaks: headline risk for the dollar and haven demand.
- Fri Oct 2 — US Non-Farm Payrolls: the week’s final test of Fed hike pricing, detailed in the week-ahead hub.
Gold holds the advantage while $4,164 stays intact: buy weakness into that level ahead of Core PCE, target $4,188, and step aside if a 15-minute candle closes beneath it.
London Session Update
Price Check
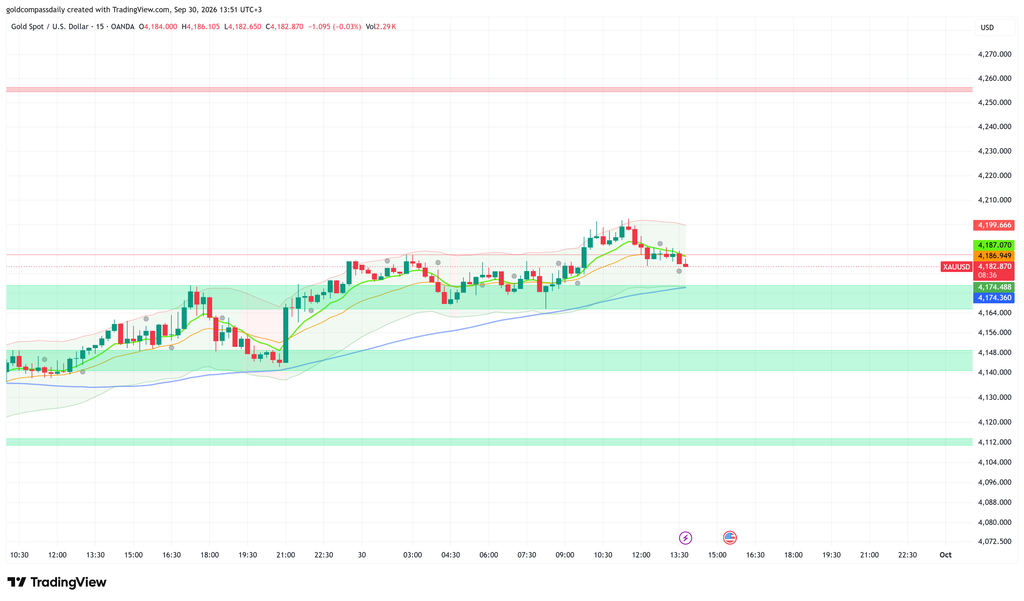
Gold trades at $4,183, above the $4,175 level from the morning analysis. Gold Compass Daily’s morning analysis projected a cautiously bullish session with a $4,188 target, and that call held: buyers cleared $4,188 and reached $4,200 before sellers rejected the move.
What Changed
The rejection at $4,200 is the new development. Price pushed to a high near $4,202 in the late London morning, hit the upper edge of the 15-minute volatility band at $4,199.7, and gave back about $19 in a series of lower highs. The pullback has taken price under the short-term moving average cluster at $4,187, which turns that level from support into resistance for now. The bounce off the morning’s $4,175 area shows that dip buyers remain active. The pullback is a pause after a two-day recovery rather than a reversal. US data is still ahead: ADP Non-Farm Employment at 15:15 UTC+3 and Core PCE at 15:30 UTC+3. The market appears to be reducing risk before those releases, which explains the fading momentum after $4,200.
Updated Levels
- Current price: $4,183
- Bias now: Cautiously bullish, unchanged. The higher-low structure and rising 200-period moving average remain intact, and the bias holds above $4,174.
- Updated support: $4,174 → $4,165 → $4,149
- Updated resistance: $4,187 → $4,200 → $4,202
- London session target: $4,174 (retest of the 200-period moving average before the next attempt higher)
Scenarios Into the NY Handoff
Bull: a hold above $4,174 into the US data and a 15-minute close back above $4,187 → $4,200, with a break above $4,202 opening the $4,210 area. Bear: a 15-minute close below $4,174 → $4,165, and a loss of that zone exposes $4,149.
Chart Analysis
The 15-minute chart shows an intact uptrend that has stalled at $4,200. Price at $4,183 sits below the converged short-term moving averages at $4,187, which have flattened and started to roll over after the rejection candle, a sign of fading short-term momentum. The 200-period moving average has climbed from $4,164.6 this morning to $4,174.4 and now runs along the top of the $4,165–$4,175 demand zone, giving gold a layered support base that was defended twice today. The $4,200–$4,202 area is confirmed as the near-term ceiling, with the upper volatility band at $4,199.7 coinciding with it. Further out, the $4,141–$4,149 zone and the $4,112 base remain the deeper supports, while a broad supply zone sits well above near $4,255. The projected path is a drift lower to retest $4,174 into the US data, followed by a directional move after Core PCE. The levels are confirmed with one adjustment from the morning: resistance shifts from $4,188 to the $4,187 moving average cluster, with $4,200 as the next barrier, and the 200-period moving average now sits at $4,174 instead of $4,164.
New York Session Update
Price Check
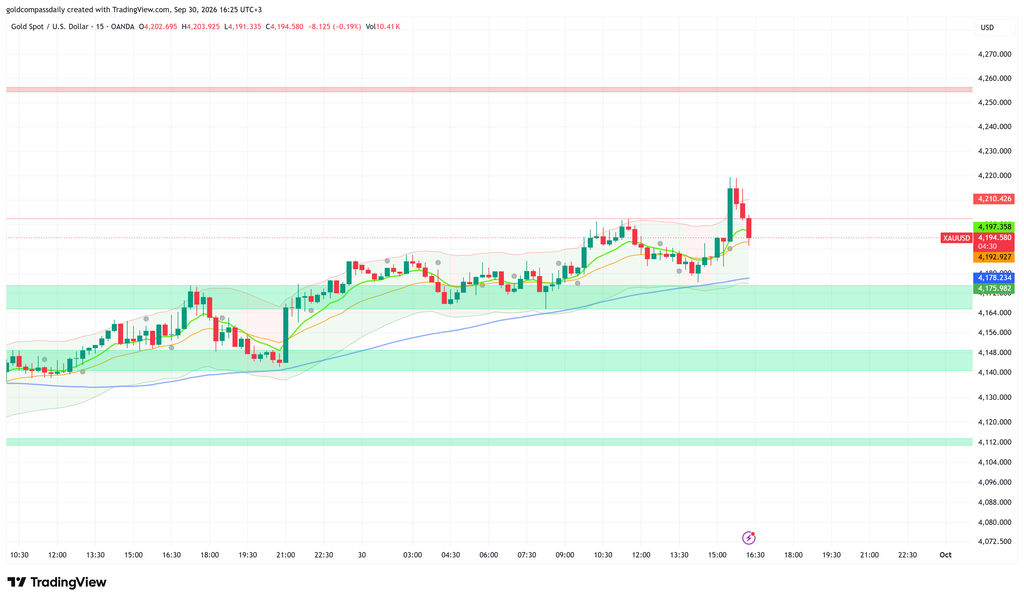
Gold trades at $4,195, above both the $4,175 level from the morning analysis and the $4,183 level from the London update. Gold Compass Daily’s morning analysis projected a cautiously bullish session, and that bias held: price retested the 200-period moving average zone near $4,176 in the early afternoon, as the London update flagged, and then rallied to a new session high.
What Changed
The US data window at 15:15 and 15:30 UTC+3 produced the session’s main volatility. Price rebounded from the $4,176 low, spiked to roughly $4,219 on a large 15-minute candle around the Core PCE release, and then gave back about $25 in three consecutive red candles, leaving the $4,200 area, the rejection point from London, as the level buyers must reclaim. The spike cleared the $4,200–$4,202 ceiling but could not hold above it, so that zone now acts as resistance again on a closing basis. Volume on the spike candle was well above anything earlier in the session, which shows the data drew real positioning rather than thin-market noise. The pullback is testing the short-term moving averages at $4,197 and $4,193, and the next session inputs are the Chicago PMI at 16:45, crude inventories at 17:30, and Fed speakers Barkin (20:30) and Cook (22:25), followed by President Trump at 22:30.
Updated Levels
- Current price: $4,195
- Bias now: Cautiously bullish, unchanged. The higher-low structure held at the 200-period moving average, and the bias stays intact above $4,178.
- Updated support: $4,193 → $4,178 → $4,165
- Updated resistance: $4,210 → $4,219 → $4,255
- NY session target: $4,178 (retest of the 200-period moving average) before a second attempt at $4,210
Scenarios Into the Close
Bull: a hold above $4,178 on the retest and a 15-minute close back above $4,210 → $4,219, with a clean break opening the $4,255 supply zone. Bear: a 15-minute close below $4,178 → $4,165, and a loss of that zone exposes $4,149.
Chart Analysis
The 15-minute chart shows an uptrend with a stretched, volatile spike on top. Price at $4,195 sits just under the short-term moving averages at $4,197 (fast) and $4,193 (slow), which have turned upward after the data candle, though the current red candle is pressing against the slower line. The 200-period moving average has risen to $4,178.2 and runs along the top of the $4,165–$4,176 demand zone, which was defended again this afternoon and remains the key base for the trend. The long upper wicks on the $4,219 spike and the next candle mark that level as fresh supply, with the upper volatility band at $4,210 as the intermediate barrier, while the horizontal supply zone near $4,255 is the next major target if $4,219 breaks. The $4,141–$4,149 zone and the $4,112 base remain deeper supports. The projected path is a pullback toward $4,178, where a hold would set up a second push toward $4,210–$4,219. The levels are confirmed with adjustments: the 200-period moving average has moved from $4,174 to $4,178, resistance extends from $4,200 to $4,210–$4,219, and the upside target on the chart is the $4,255 supply zone rather than $4,260.
New York Close & Asian Session Outlook
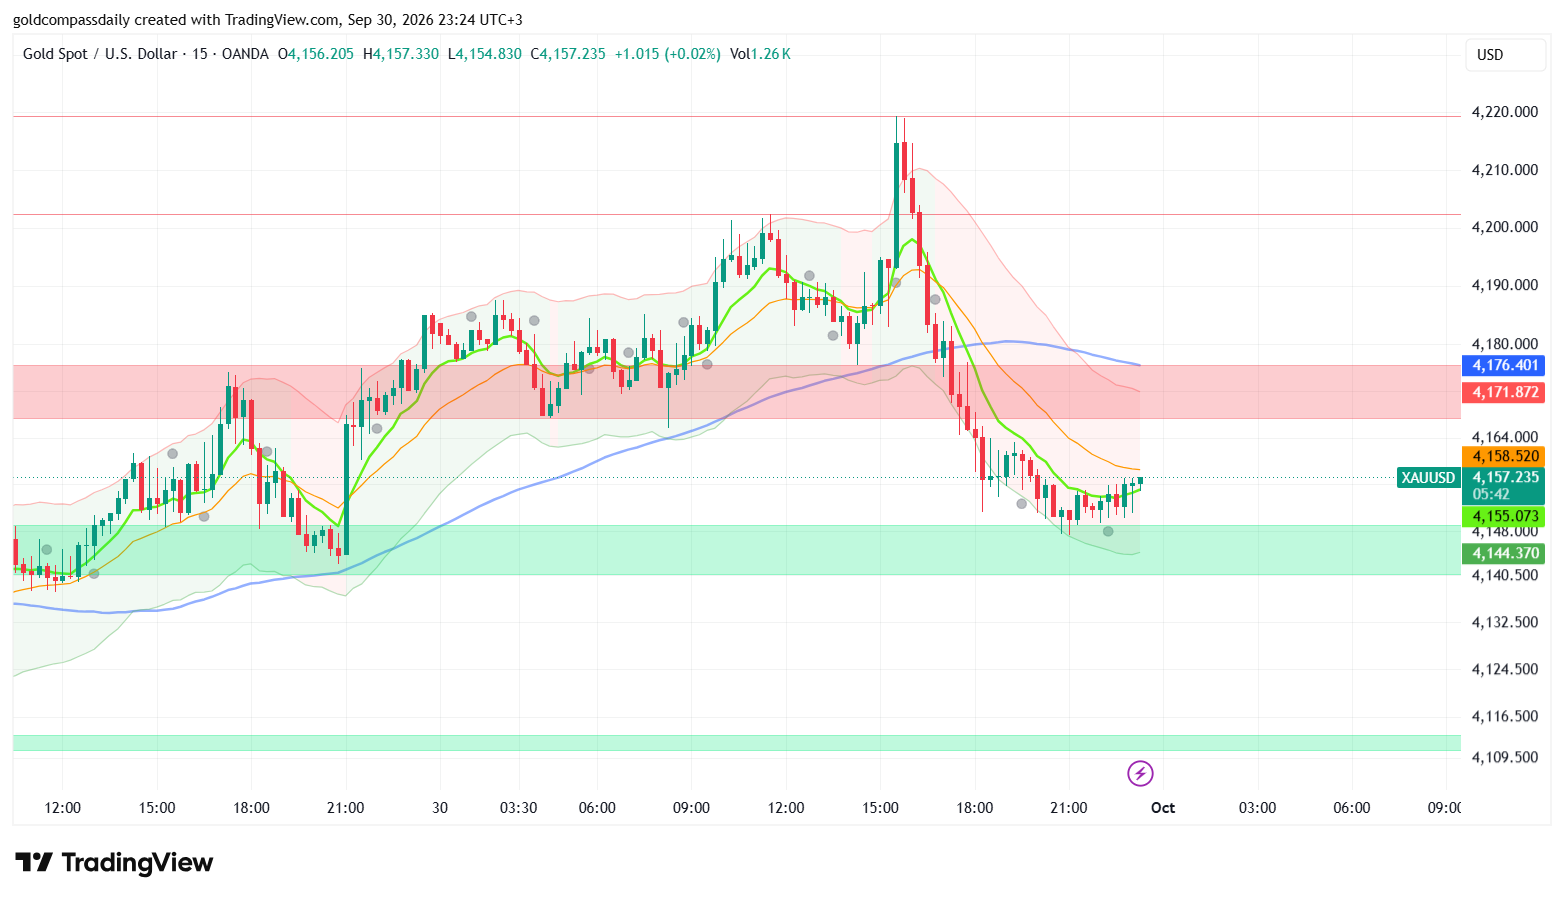
Gold closed the New York session at $4,157 — bearish-to-neutral — and the morning thesis failed. Gold Compass Daily’s morning analysis projected a cautiously bullish session above $4,164, and the afternoon reversal from $4,219 closed below that invalidation level.
Updated Key Levels
- NY close: $4,157
- Session high / low: $4,219 / $4,147
- Bias into Asian session: Neutral, turning bullish only above $4,176
- Asian session support: $4,149 → $4,141
- Asian session resistance: $4,172 → $4,176
Chart Read at Close
Price at $4,157 sits between the fast moving average at $4,155 and the slower one at $4,158.5, both now pointing down from the spike. The 200-period moving average at $4,176 has flattened and sits above price, turning from support into resistance. The $4,141–$4,149 demand zone held the sell-off, and price is hugging the lower Bollinger Band at $4,144, which shows an extended move. The last candles are small and green with shallow pullbacks, so buyers are stabilising but have not taken control. The chart carries no projection arrow, so the path below rests on structure: a bounce inside the $4,167–$4,176 supply zone is the likely ceiling.
Asian Session Outlook
Expect range-bound trade between $4,147 and $4,172 during the 00:00–09:00 UTC+3 window, with thin liquidity and Fed speakers Goolsbee (00:10) and Kashkari (01:00) as the early risks. A sweep of the $4,147 low toward $4,141 before London is plausible, and a hold there would set up a recovery toward $4,172, the level most likely to be tested.
Next Day Bull / Bear Scenarios
Bull trigger: a 15-minute close above $4,176 (200-period moving average) → $4,188, then $4,200.
Bear trigger: a 15-minute close below $4,141 → $4,112.
Tomorrow’s Key Events
- 02:50 — Japan Tankan Manufacturing Index (25): a read on Asian industrial demand at the open.
- 15:30 — US Unemployment Claims (201K): labour data shifts Fed rate expectations ahead of payrolls.
- 16:30 — ECB President Lagarde speaks: euro moves feed directly into the dollar and gold.
- 17:00 — US ISM Manufacturing PMI (54.8) and ISM Prices (72.9): hot prices support the rate-hike case and pressure gold.
- 17:00 — FOMC Member Waller speaks: a hawkish tone would test the $4,141 demand zone.
- 22:00 — FOMC Member Bowman speaks: late-session rate commentary can extend the day’s move.
Analysis based on the XAU/USD 15-minute chart as of September 30, 2026, 08:49 UTC+3. This article is for informational and educational purposes only and does not constitute financial advice.