Gold Holds $4,132 as ISM Services PMI Tests $4,120 Floor
T. S. Gospodinov
Mon, October 5, 2026 at 6:01 AM • 10 min read
Headline Thesis
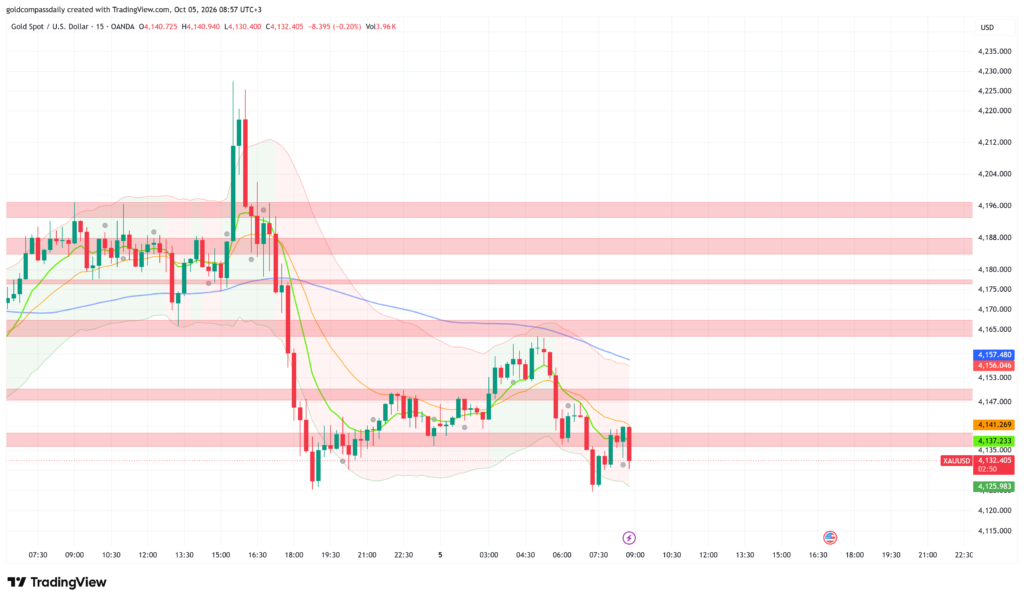
Gold trades neutral at $4,132 — the market is rebuilding after Friday’s sharp reversal and needs confirmation on both sides of the $4,120–$4,140 range. Buyers defended $4,125 twice this morning, but price remains below every short-term moving average. Bias flips to buy only on a confirmed hold at $4,120 or a clean break above $4,140, as outlined in the week-ahead outlook.
Key Levels
- Bias: Neutral below $4,140; cautiously bullish above $4,140 on a confirmed 15-minute close
- Support: $4,125 → $4,120
- Resistance: $4,140 → $4,150 → $4,165
- Session target: $4,150 (conditional on ISM Services PMI printing below the 55.1 forecast)
- Invalidation: Below $4,120 = Friday’s reversal extends and the week-ahead floor fails, opening $4,100
Catalyst of the Day
The ISM Services PMI is the priority for gold today. The services sector is the largest part of the US economy, so the print directly shapes rate expectations. A reading above the 55.1 forecast (previous: 55.4) would support US yields and the dollar, pressuring gold toward $4,120. A softer print would ease yield pressure and give buyers room to challenge $4,140–$4,150. Watch the release at 17:00 Sofia time (10:00 ET), with the Final Services PMI at 16:45 (forecast 58.7) as the early signal.
Fundamental Context
Gold’s setup this week is a repricing after the volatility around Friday’s US employment data. Gold was holding near $4,192 into the release. The metal then spiked toward $4,227 and gave back the entire move within hours. A reversal of that size shows sellers defending higher levels and leaves positioning sensitive to the next major US data point.
Europe supplies the early session flow. Eurozone Services PMI is forecast at 53.0, unchanged from the prior reading, with Spanish (57.1) and Italian (54.6) readings both expected below their previous prints. Sentix Investor Confidence is forecast at 4.5 against 5.1 previously. Softer European data weighs on the euro, which lifts the dollar and caps gold. Eurozone PPI (forecast 1.9% m/m vs 1.6% prior) matters in the opposite direction, since firmer producer prices can keep ECB policy tighter for longer and support the euro. Bundesbank President Nagel speaks at 10:45 Sofia time, and hawkish remarks would reinforce that euro support.
The Asia-Pacific session offered little. The Chinese bank holiday thins physical demand signals from the world’s largest gold consumer, which reduces buying support on dips during early trade. Australia’s inflation gauge (0.3% vs 0.5% prior) points to cooling price pressure, a marginal positive for global rate-cut expectations.
Chart Analysis
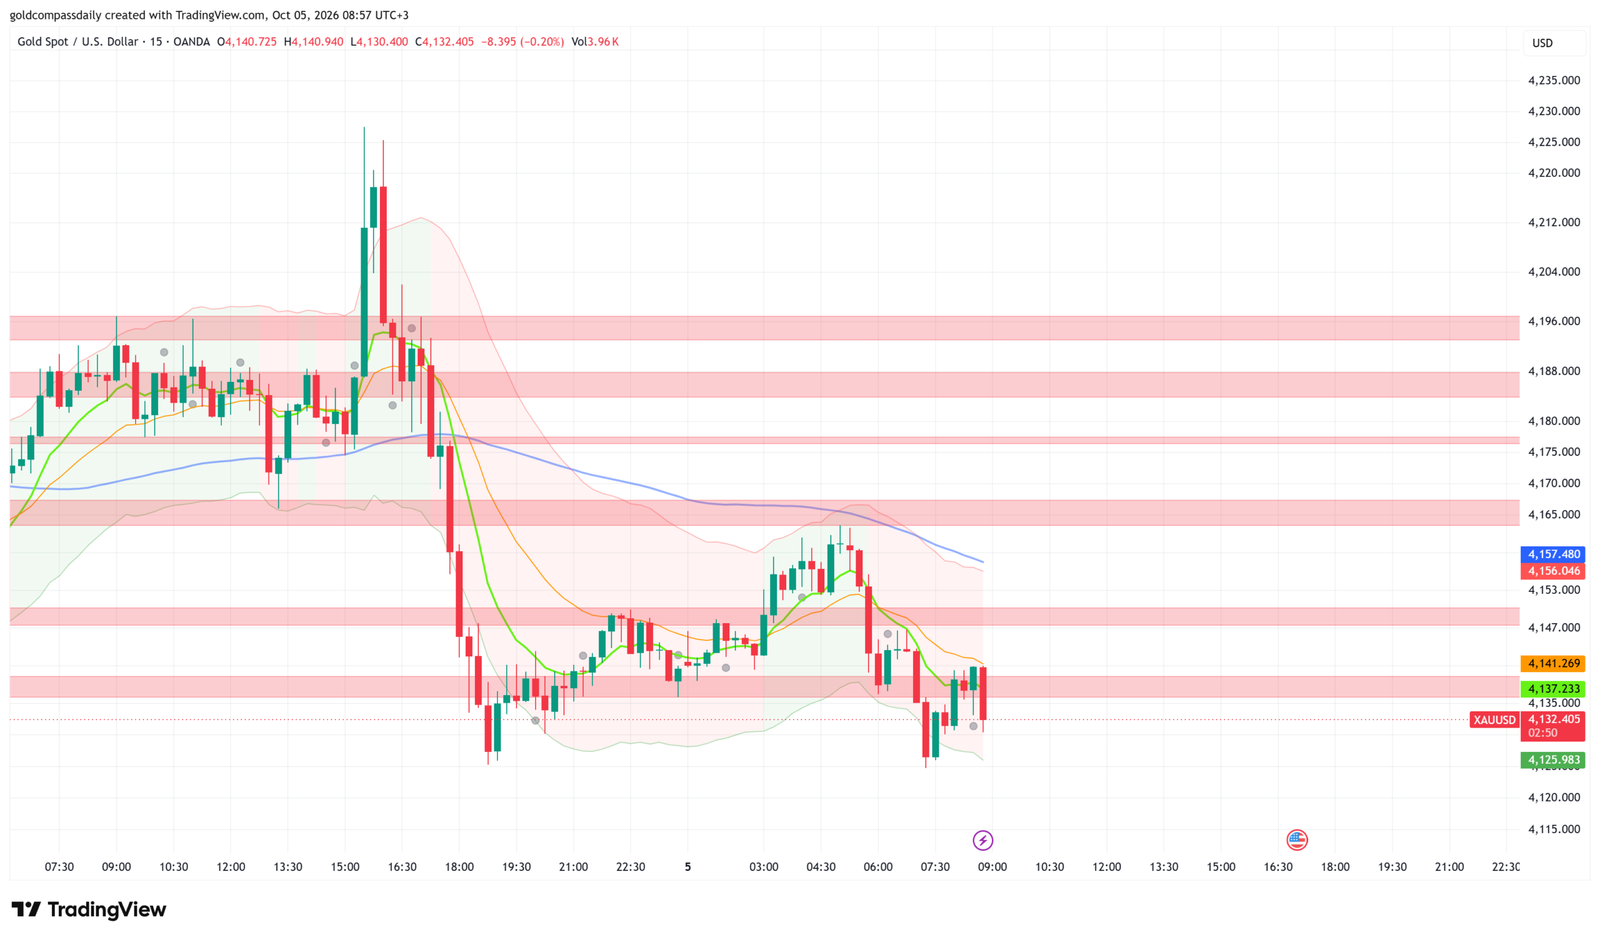
On the 15-minute chart, gold trades at $4,132 in a corrective structure after the Friday collapse from the $4,227 spike high. Price is below all three moving averages: the fast average sits near $4,137, the medium average near $4,141, and the slow average near $4,157 and sloping lower, which confirms short-term bearish momentum. The $4,135–$4,140 band is the immediate supply zone, and price has rejected it repeatedly. Above it, supply zones stack at $4,147–$4,150, $4,163–$4,167, $4,176–$4,178, and $4,184–$4,196. Support is the $4,125 area, which formed a double bottom (the Friday evening low and this morning’s low), with $4,120 beneath it. The lower volatility band near $4,126 coincides with that floor, so a close below it would signal momentum expansion. The projected path is a range between $4,125 and $4,140 until ISM Services PMI. The chart confirms the supplied levels: $4,140 is resistance, and $4,120 is the line that decides whether the week-ahead floor holds.
Bull / Bear Scenarios
Bull trigger: a 15-minute close above $4,141 (reclaiming the medium moving average) combined with an ISM Services PMI below 55.1 → $4,150, then $4,165.
Bear trigger: a 15-minute close below $4,120 combined with an ISM Services PMI above 55.1 → $4,100.
Events Ahead
- Mon 10:45 — German Buba President Nagel speaks: hawkish tone supports the euro and caps dollar strength, mildly positive for gold
- Mon 11:30 — Eurozone Sentix Investor Confidence (4.5): a miss weakens the euro and lifts the dollar
- Mon 12:00 — Eurozone PPI m/m (1.9%): a hot print supports ECB hawkishness and the euro
- Mon 16:45 — US Final Services PMI (58.7): early read on the ISM release
- Mon 17:00 — US ISM Services PMI (55.1): the session’s decisive catalyst for yields and the dollar
- Later this week — FOMC Minutes: the main test of the $4,120 floor, detailed in the week-ahead outlook
Hold $4,120 into ISM Services PMI and a confirmed break above $4,141 targets $4,150; lose $4,120 and the bias turns bearish toward $4,100.
London Session Update
Price Check
Gold trades at $4,165, up about $39 from the $4,126 morning low and now testing the $4,163–$4,167 resistance zone. Gold Compass Daily’s morning analysis projected a $4,125–$4,140 range with a bullish trigger on a close above $4,141, and the trigger fired: the $4,150 first target was reached and passed.

What Changed
The recovery started at the European open, when a strong buying candle lifted price through the $4,141 level and the medium moving average. Buyers then defended every pullback with higher lows, pushing price past $4,150 and into the $4,170 area before sellers stepped in. That rejection matters because the same $4,163–$4,167 band capped the early Asian session, so it is now a tested ceiling rather than fresh resistance. The morning’s two-sided range has resolved to the upside, but the move has run into supply with the US session still ahead.
Updated Levels
- Current price: $4,165
- Bias now: Changed from neutral to cautiously bullish above $4,150. The $4,141 trigger held and price is above all three moving averages, but upside is capped until $4,167 breaks.
- Updated support: $4,157 → $4,150 → $4,135
- Updated resistance: $4,167 → $4,172 → $4,177
- London session target: $4,150 (conditional on rejection at $4,163–$4,167 and a close below $4,157)
Scenarios Into the NY Handoff
Bull: a 15-minute close above $4,167 → $4,177, then the $4,184–$4,188 supply zone. Bear: continued rejection at $4,163–$4,167 and a close below $4,157 → $4,150, with a loss of that zone exposing $4,135 ahead of the 17:00 ISM Services PMI.
Chart Analysis
On the 15-minute chart, gold is in a short-term uptrend from the $4,126 low, with a clear sequence of higher lows since 09:00. The moving averages are stacked bullishly and sloping higher: the fast average sits near $4,163 just below price, the medium near $4,157, and the slow near $4,153, which price reclaimed at the European open. The grey supply zone at $4,163–$4,167 is where price is stalling, and the last few candles show small bodies with upper wicks near $4,170, a sign of fading momentum. The upper volatility band near $4,172 reinforces that ceiling, and the next supply zones stack at $4,176–$4,178, $4,184–$4,188 and $4,193–$4,197. Support sits in the green demand zone at $4,147–$4,151, which lines up with the medium and slow averages, and below it at $4,132–$4,135. The projected path is a shallow pullback toward $4,157–$4,150, where buyers are likely to defend the higher-low structure, before the next attempt at $4,167. The chart confirms the supplied reading: resistance at $4,163 is being tested, and a rejection points to $4,150.
New York Session Update
Price Check
Gold trades at $4,158, roughly $26 above the $4,132 level where the morning analysis was written and inside the $4,125–$4,140 range’s upside breakout zone. Gold Compass Daily’s morning analysis projected a neutral stance with a bullish trigger above $4,141. That trigger held, and the $4,150 target was reached, though price has failed twice to extend beyond $4,170.

What Changed
The new development since the London update is a second rejection near $4,170. Price pushed into that area in the early afternoon, then reversed sharply in a single large bearish candle that retraced the move down to the $4,150 area. Buyers stepped in there, and support around $4,149 is still holding. Price has since stalled at the fast and medium moving averages, and the small-bodied candles show a market waiting for a catalyst. The US Final Services PMI (16:45 Sofia time) and the ISM Services PMI (17:00) are still ahead, which explains the compression: the range is tightening ahead of the session’s main data release.
Updated Levels
- Current price: $4,158
- Bias now: Cautiously bullish above $4,149, unchanged from the London update but with softer momentum. The higher-low structure is intact, yet two failures near $4,170 show sellers defending the upper range.
- Updated support: $4,149 → $4,144 → $4,135
- Updated resistance: $4,162–$4,167 → $4,172 → $4,177
- NY session target: $4,167 (conditional on a hold above $4,149 into the ISM release)
Scenarios Into the Close
Bull: a hold above $4,149 and a 15-minute close above $4,167 → $4,172, then $4,177. Bear: a 15-minute close below $4,149 → $4,144, with a loss of that level exposing $4,135.
Chart Analysis
On the 15-minute chart, gold is range-bound between $4,150 and $4,170 after the recovery from the $4,126 morning low. Price at $4,157.9 sits on top of the fast moving average ($4,158.7) and the medium average ($4,158.0), which are flattening and converging, a sign of indecision rather than trend. The slow average near $4,149 is sloping lower and now overlaps the green demand zone at $4,147–$4,151, which makes that area the key structural floor. Two highs near $4,170 form a short-term double top, capped by the upper volatility band at $4,172. The supply zone at $4,162–$4,167 sits directly above price, with further supply at $4,176–$4,178, $4,184–$4,188 and $4,193–$4,197. The lower volatility band near $4,144 and the demand zone at $4,132–$4,135 mark the deeper support. The projected path is continued consolidation between $4,149 and $4,167 until the ISM release, with the bias flipping on a close outside that range. The chart confirms the supplied reading: support at $4,149 is holding, and $4,167 is the ceiling that must break for the next leg higher.
New York Close & Asian Session Outlook
Price Check
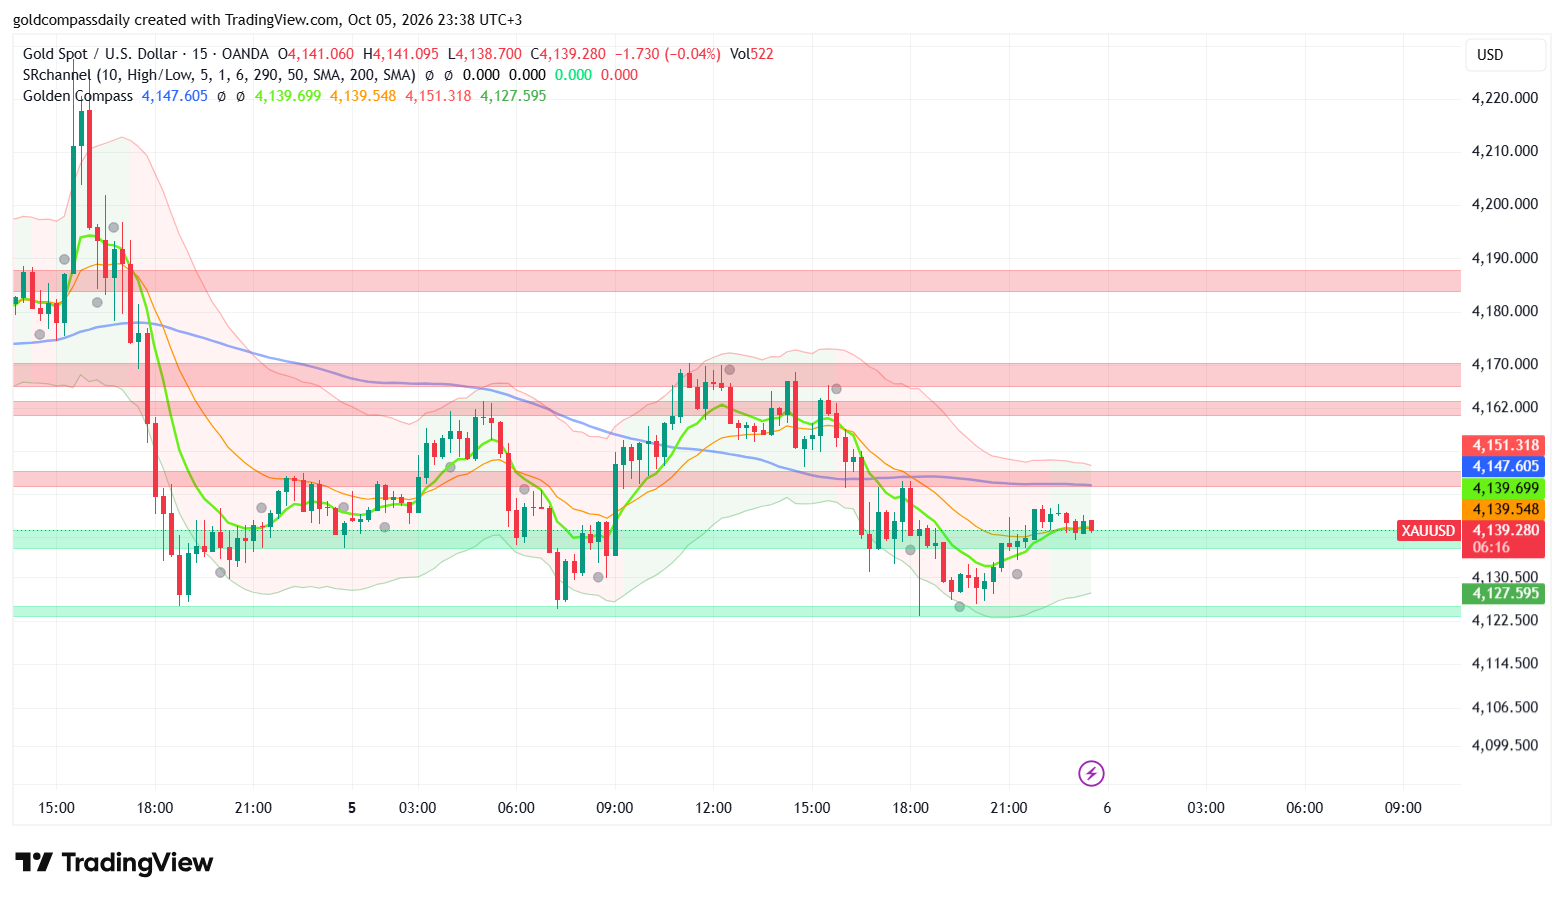
Gold trades at $4,139, back below the $4,141 trigger and about $7 above the $4,132 level where the morning analysis was written. Gold Compass Daily’s morning analysis projected a $4,120 floor, and that floor held: the New York session low near $4,122 was bought, but the bullish extension to $4,150 and beyond failed to hold.
What Changed
The upside move did not survive the New York session. Price made a second failed attempt at the $4,166–$4,170 supply zone in the early afternoon, forming a lower high below Friday’s $4,227 spike. Selling then built through the late-afternoon US session and drove gold through the $4,150 support and the $4,136–$4,140 demand zone, to a low near $4,122. Buyers absorbed that move at the same $4,122–$4,126 area that stopped price on Friday evening and again at the Monday morning low, so the floor has now been tested three times. The recovery since has been shallow, with small-bodied candles and no follow-through, which marks a market in repair mode rather than reversal.
Updated Levels
- Current price: $4,139
- Bias now: Neutral, a return to the morning stance. The $4,120 floor held, which keeps the range intact, but the failed push above $4,167 and the lower-high structure remove the cautiously bullish tilt from the London update.
- Updated support: $4,136 → $4,127 → $4,122 (floor: $4,120)
- Updated resistance: $4,148–$4,152 → $4,160–$4,163 → $4,166–$4,170
- Tomorrow sessions target: $4,151 (conditional on a hold above $4,136 and a reclaim of $4,141; an extension to $4,162 requires a close above $4,152)
Scenarios Into Asia
Bull: a 15-minute close above $4,148 (clearing the slow moving average and the first supply zone) → $4,162. Bear: a 15-minute close below $4,122 → $4,100, which would confirm that the triple-tested floor has failed.
Chart Analysis
On the 15-minute chart, gold trades at $4,139.3 in a tight consolidation after a sequence of lower highs: $4,227, then $4,170, then $4,168. The fast and medium moving averages sit at $4,139.7 and $4,139.5, flat and wrapped around price, which signals indecision. The slow moving average near $4,147.6 slopes lower above price and acts as dynamic resistance. The volatility bands have narrowed to $4,127.6 on the downside and $4,151.3 on the upside, a squeeze that typically precedes expansion. Price is sitting inside the green demand zone at $4,136–$4,140, with a second demand zone at $4,122–$4,125 beneath it, where the three recent lows form a triple-bottom structure. Overhead supply stacks at $4,148–$4,152, $4,160–$4,163, $4,166–$4,170 and $4,184–$4,188, so rallies face resistance at every step. The projected path is a range between $4,127 and $4,148 through the Asian session, with the direction decided by a close outside it. The chart confirms the supplied reading: $4,122 was tested and held, and the $4,120 floor remains intact.
Analysis based on the XAU/USD 15-minute chart as of October 5, 2026, 08:57 UTC+3. This article is for informational and educational purposes only and does not constitute financial advice.
Economic Calendar
Disclaimer
The content on Gold Compass Daily is provided for educational and informational purposes only. It does not constitute financial, investment, tax, or legal advice.