
Gold trades cautiously bullish at $4,188, consolidating above the key $4,170 demand zone following Thursday’s post-CPI surge. The metal rejected the $4,240 resistance cluster and has pulled back into a short-term consolidation structure, with the 15-minute chart projecting a potential retest of $4,170 before a resumption higher. The session bias remains constructive as long as the $4,170 floor holds, with the University of Michigan Consumer Sentiment and Inflation Expectations print at 17:00 UTC+3 the primary catalyst ahead.
Key Levels
- Bias: Cautiously Bullish above $4,170
- Support: $4,170 (demand zone) → $4,143 → $4,120
- Resistance: $4,216 → $4,240 (supply cluster) → $4,309
- Session target: $4,240 (conditional on $4,170 holding and soft UoM sentiment)
- Invalidation: Below $4,170 on a closing basis opens $4,143–$4,120
Catalyst of the Day
The University of Michigan Preliminary Consumer Sentiment and Inflation Expectations data, due at 17:00 UTC+3, is the session’s primary price-moving event for gold. The sentiment index is forecast at 46.1 against a prior reading of 44.8 — a modest improvement but still historically depressed territory. More critically for gold, the inflation expectations component carries outsized weight: the prior reading of 4.8% reflects persistently elevated consumer price anxiety, and any upward surprise would reinforce the stagflation narrative that has been a structural tailwind for the metal throughout 2026. A softer-than-expected sentiment print, or inflation expectations holding above 4.5%, would support renewed buying interest toward the $4,240 supply zone.
Fundamental Context
Thursday’s US CPI release delivered the week’s key macro verdict, and gold’s response — a sharp move from the $4,093 area to a high of $4,254 intraday — confirmed the metal’s sensitivity to disinflationary surprises in the current environment. With the Federal Reserve holding rates at elevated levels, any evidence that inflation is decelerating without a proportional growth recovery keeps real yield expectations capped, removing a key headwind for non-yielding assets such as gold. The post-CPI consolidation now in play is a structural digestion of that move, not a trend reversal.
This morning’s UK GDP print added a layer of global risk-off texture to Friday’s session. The UK economy contracted by 0.1% in April against a forecast of 0.3% growth, with manufacturing production missing badly at -0.2% versus a 1.2% consensus estimate. While UK data does not directly drive XAU/USD, a pattern of developed-market growth disappointments reinforces the case for central bank caution globally — a macro backdrop in which gold has historically performed well. The ECOFIN Meetings running through the day and German Bundesbank President Nagel’s speech at 17:30 UTC+3 are secondary but worth monitoring for any shift in European monetary tone that could move the dollar.
Chart Analysis
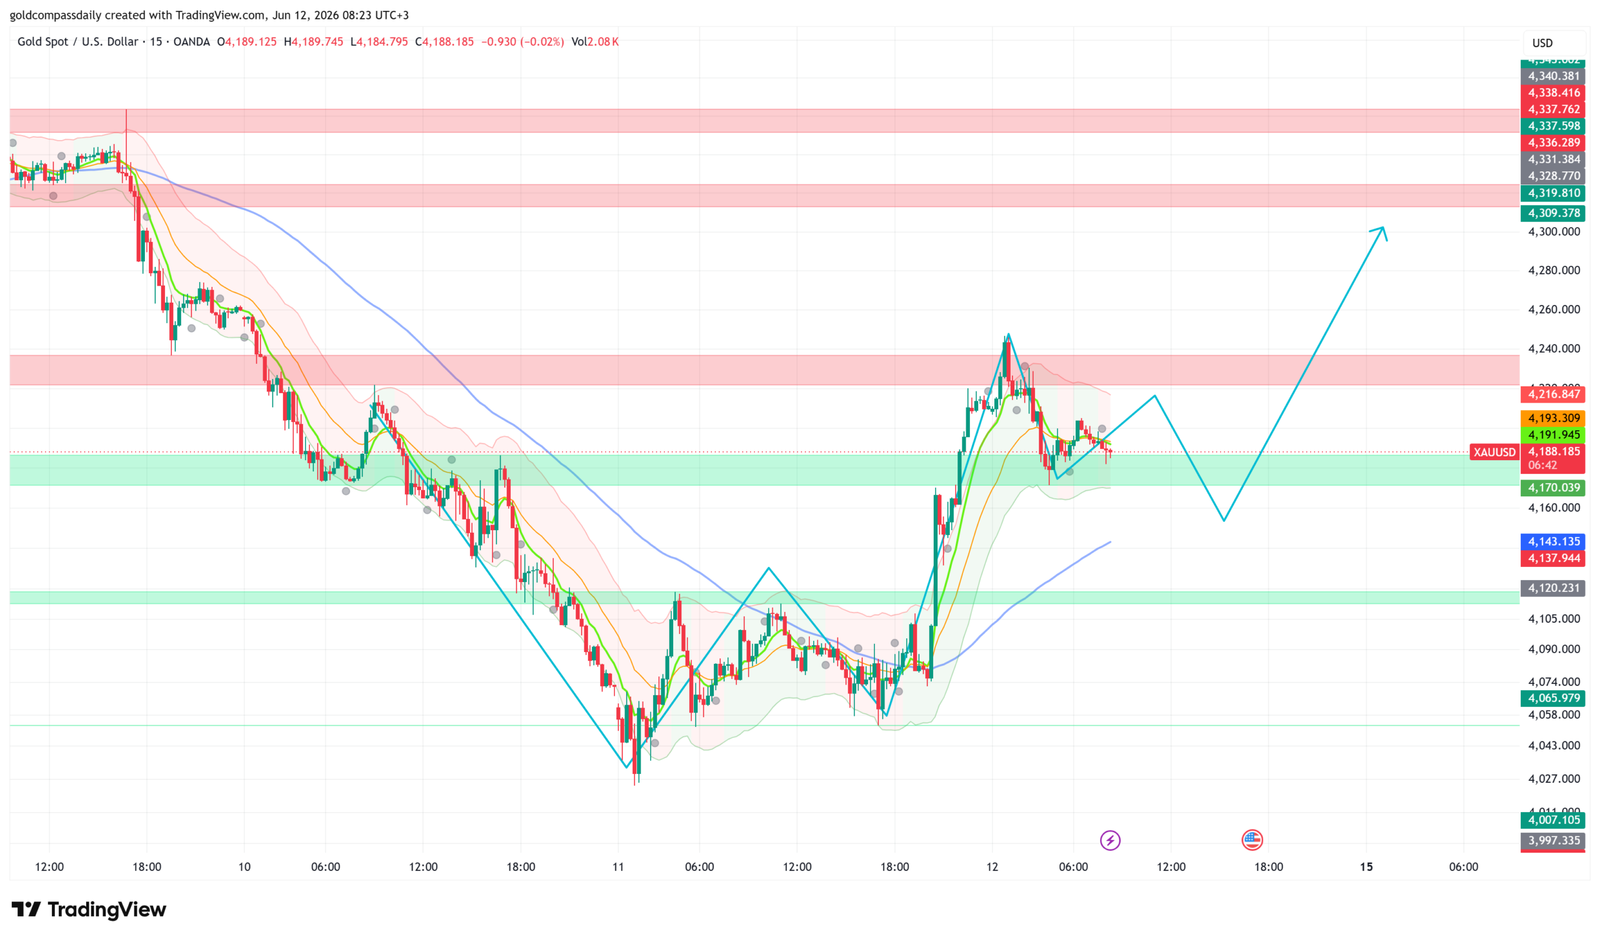
The 15-minute XAU/USD chart shows price trading at $4,188 following a sharp V-shaped recovery from the June 11 low near $4,040, with the advance peaking at $4,254 before sellers absorbed the move at the $4,240 supply cluster — a zone marked clearly on the chart as a multi-level resistance band. Price has since pulled back into the $4,170–$4,193 demand zone, which aligns with the chart’s green horizontal support band and the 200 EMA, now acting as a dynamic floor. The short-term moving average stack (green and orange EMAs) has turned upward and is beginning to converge beneath price, consistent with a bullish consolidation structure. The projected path annotated on the chart suggests a further retest of the $4,160–$4,170 area before a higher-low forms and price attempts a second push toward $4,309. The structure is constructive provided $4,170 holds on a closing basis.
Bull / Bear Scenarios
Bull trigger: $4,170 holds as support through the London close, and UoM Inflation Expectations print at or above 4.7% → renewed buying targets $4,216, then $4,240, with an extended session move toward $4,309 if momentum sustains.
Bear trigger: Hourly close below $4,170 on above-average volume → structural support invalidated, opening a flush toward $4,143 and potentially $4,120, where the next major demand zone resides and where buyers previously stepped in on June 11.
Events Ahead
- Friday 17:00 UTC+3 — US Prelim UoM Consumer Sentiment (forecast 46.1, prior 44.8): Weak sentiment and elevated inflation expectations are directly bullish for gold as a stagflation hedge.
- Friday 17:00 UTC+3 — US Prelim UoM Inflation Expectations (prior 4.8%): The most gold-relevant print of the session; an upside surprise reinforces the structural bull case.
- Friday 17:30 UTC+3 — German Bundesbank President Nagel Speaks: Hawkish ECB tone could pressure EUR/USD and indirectly support USD, creating a headwind for gold near resistance.
- Next week — FOMC speakers and US macro data will set the tone for the following week’s gold trajectory; the Gold Compass Daily weekly hub outlines the broader macro framework in play.
For session context, Gold Compass Daily’s Thursday pre-CPI analysis outlined the $4,184 holding pattern ahead of the data, and the June 11 mid-session update tracked the $4,093 demand zone that preceded Thursday’s surge.
New York Session Update
Price Check
Gold has advanced to $4,208 at the time of this update, holding above the $4,170 demand zone identified in the morning analysis and pushing into the lower boundary of the $4,228–$4,240 supply cluster. The morning buy bias remains intact, with price tracking the projected path toward the session target.

What Changed
Since the morning open, price action has defined a tightening consolidation channel between $4,170 and $4,230, with successive higher lows forming along the $4,184–$4,206 base. The University of Michigan Preliminary Consumer Sentiment came in at 46.1 — broadly in line with consensus — while Inflation Expectations held at 4.8%, sustaining the stagflation narrative that has underpinned gold’s bid throughout the week. No material upside dollar catalyst has emerged to challenge the bullish structure, and the NY session open has seen incremental buying pressure drive price toward the upper boundary of the established channel.
Updated Levels
- Current price: $4,208
- Bias now: Cautiously Bullish — unchanged; channel structure intact above $4,170
- Updated support: $4,184 → $4,170
- Updated resistance: $4,213 → $4,228 → $4,240
- NY session target: $4,240 on a clean break above $4,228
Scenarios Into the Close
Bull: Hourly close above $4,228 with sustained volume → channel breakout targets $4,240 and opens a path toward $4,309 into next week.
Bear: Rejection at $4,228 and break below $4,184 on a closing basis → pullback toward $4,170 support, where the morning thesis requires a clean hold to remain valid.
Chart Analysis
The 15-minute chart shows XAU/USD at $4,208, consolidating beneath the $4,228 resistance level after a constructive recovery from the $4,184 intraday low. The short-term EMA stack — green and orange — has resumed an upward trajectory and is now positioned beneath price, providing dynamic support in the $4,200–$4,205 area. The Bollinger Bands have begun to contract after the post-CPI expansion, consistent with a consolidation phase ahead of a directional move. The chart’s projected path maintains the annotated higher-low structure, with a shallow retest of the $4,170–$4,184 zone remaining possible before the next leg higher toward $4,309. The $4,228–$4,240 supply band is the immediate barrier; a decisive 15-minute close above it would confirm the breakout and shift the near-term structure fully bullish.
Analysis based on the XAU/USD 15-minute chart as of June 12, 2026, 08:23 UTC+3. This article is for informational and educational purposes only and does not constitute financial advice.