
Gold Market Outlook 2026: A Strategic Top-Down Assessment
The precious metals market is currently navigating a period of significant structural realignment. Following the aggressive price action observed on February 6, 2026, gold (XAU/USD) has transitioned from a parabolic rally into a complex corrective phase. This Gold Market Outlook 2026 provides a comprehensive top-down analysis, synthesizing macro trends with intraday execution levels to establish a clear trading bias.


I. The Macro Framework (4-Hour Timeframe)
From a macro perspective, the recent price depreciation represents a necessary technical correction. After testing historical resistance levels, the market has retreated toward the $4,750 support zone. This shift is fundamentally supported by a strengthening U.S. Dollar Index and a pivot in Federal Reserve policy expectations following recent leadership nominations.
The 4-hour chart suggests that while the long-term bullish structure remains intact, a period of consolidation is required to absorb the current selling pressure. Investors should monitor the stability of the $4,700–$4,750 range as a primary indicator of market health.
Extended Analysis: Gold 4H Analysis: Technical Liquidation and Support Zones.
II. The Intermediate Momentum (1-Hour Timeframe)
The hourly timeframe highlights the velocity of the recent breakdown. The failure to sustain prices above the $4,950 pivot point triggered a rapid descent, breaching the 50 and 200-period moving averages. This “liquidity void” accelerated the decline toward the $4,800 psychological threshold.
Current momentum on the 1-hour chart remains bearish, with price action characterized by lower highs and lower lows. A confirmed reclaim of the $4,900 level is essential to invalidate the immediate downward bias and signal a return to neutral-bullish conditions.
Detailed Review: Gold 1H Analysis: Structural Breakdown at 4800.
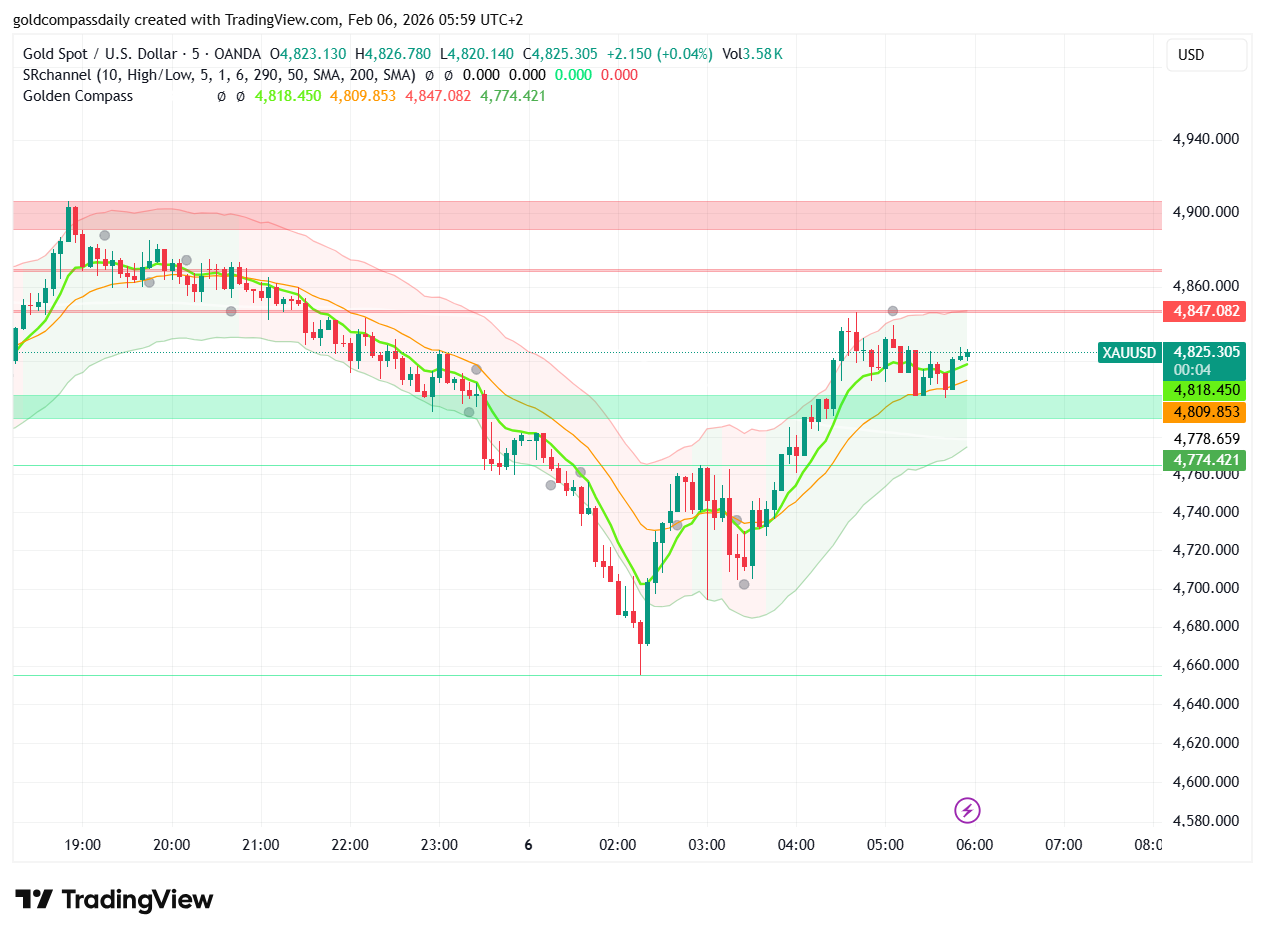
III. Short-Term Execution (5-Minute Timeframe)
The 5-minute chart provides a granular view of the “flash” events that defined the recent session. High-frequency trading algorithms and forced margin liquidations resulted in a vertical $190 price wipeout. This timeframe illustrates a classic institutional liquidity hunt, where stop-losses below $4,820 were targeted to facilitate large-scale repositioning.
While the intraday charts show extreme oversold conditions, traders should exercise caution until a definitive accumulation pattern emerges near local lows. The volatility observed on this scale underscores the risks of high-leverage positions during central bank policy shifts.
Intraday Breakdown: Gold 5M Analysis: Liquidity Hunt and Execution Levels.
Strategic Forecast and Conclusion
The Gold Market Outlook 2026 remains constructive over a long-term horizon; however, short-term technical damage cannot be ignored. The convergence of geopolitical de-escalation and hawkish monetary signals has created a challenging environment for gold bulls. Major institutional targets for the year remain near the $6,000 mark, but the immediate path will likely involve further volatility as the market seeks a definitive floor.
Market participants are advised to prioritize risk management and wait for structural confirmation at key support levels before committing to new long-term positions.