
Weekly Retrospective: Gold’s Historic Ascent in a Volatile Global Landscape
The trading week ending March 2, 2026, will be remembered as a pivotal moment for the precious metals market. Gold (XAU/USD) underwent a massive structural transformation, transitioning from a disciplined technical grind into a parabolic safe-haven rally. For traders following our daily updates, the journey from the $5,100 base to the current highs above $5,380 provided a masterclass in how technical geometry and fundamental shocks interact.
Phase 1: The Foundation (Feb 23 – Feb 26)
The week began with gold exhibiting a remarkably consistent bullish structure. Following the price action on the 1-hour and 15-minute timeframes, we observed the metal respecting an ascending channel with surgical precision. During this phase, the $5,145 level served as a critical 1.0 Fibonacci extension floor, which bulls defended multiple times. This conservative “grind” allowed moving averages to align, creating the necessary energy for the breakout that was to follow.
Phase 2: The Consolidation Trap (Feb 27)
By Friday, February 27, the market entered a neutral consolidation zone. The price oscillated between the $5,172 (0.5 Fib) and $5,218 resistance levels. To the untrained eye, the market looked exhausted, but our analysis pointed to a “liquidity building” phase. The sideways movement was a classic precursor to volatility expansion, as the market awaited a catalyst to define the direction for the new month.
Phase 3: Geopolitical Ignition and the $5,300 Breakout (March 2)
The opening of the March 2 session changed everything. Following reports of significant geopolitical escalations—specifically the US military involvement in Iran—gold gapped higher, completely bypassing previous resistance clusters. The psychological barrier of $5,300, which we had targeted for days, was breached with ease. Current trading at $5,387.150 reflects a market in full “flight-to-safety” mode.
Technical Levels to Watch This Week
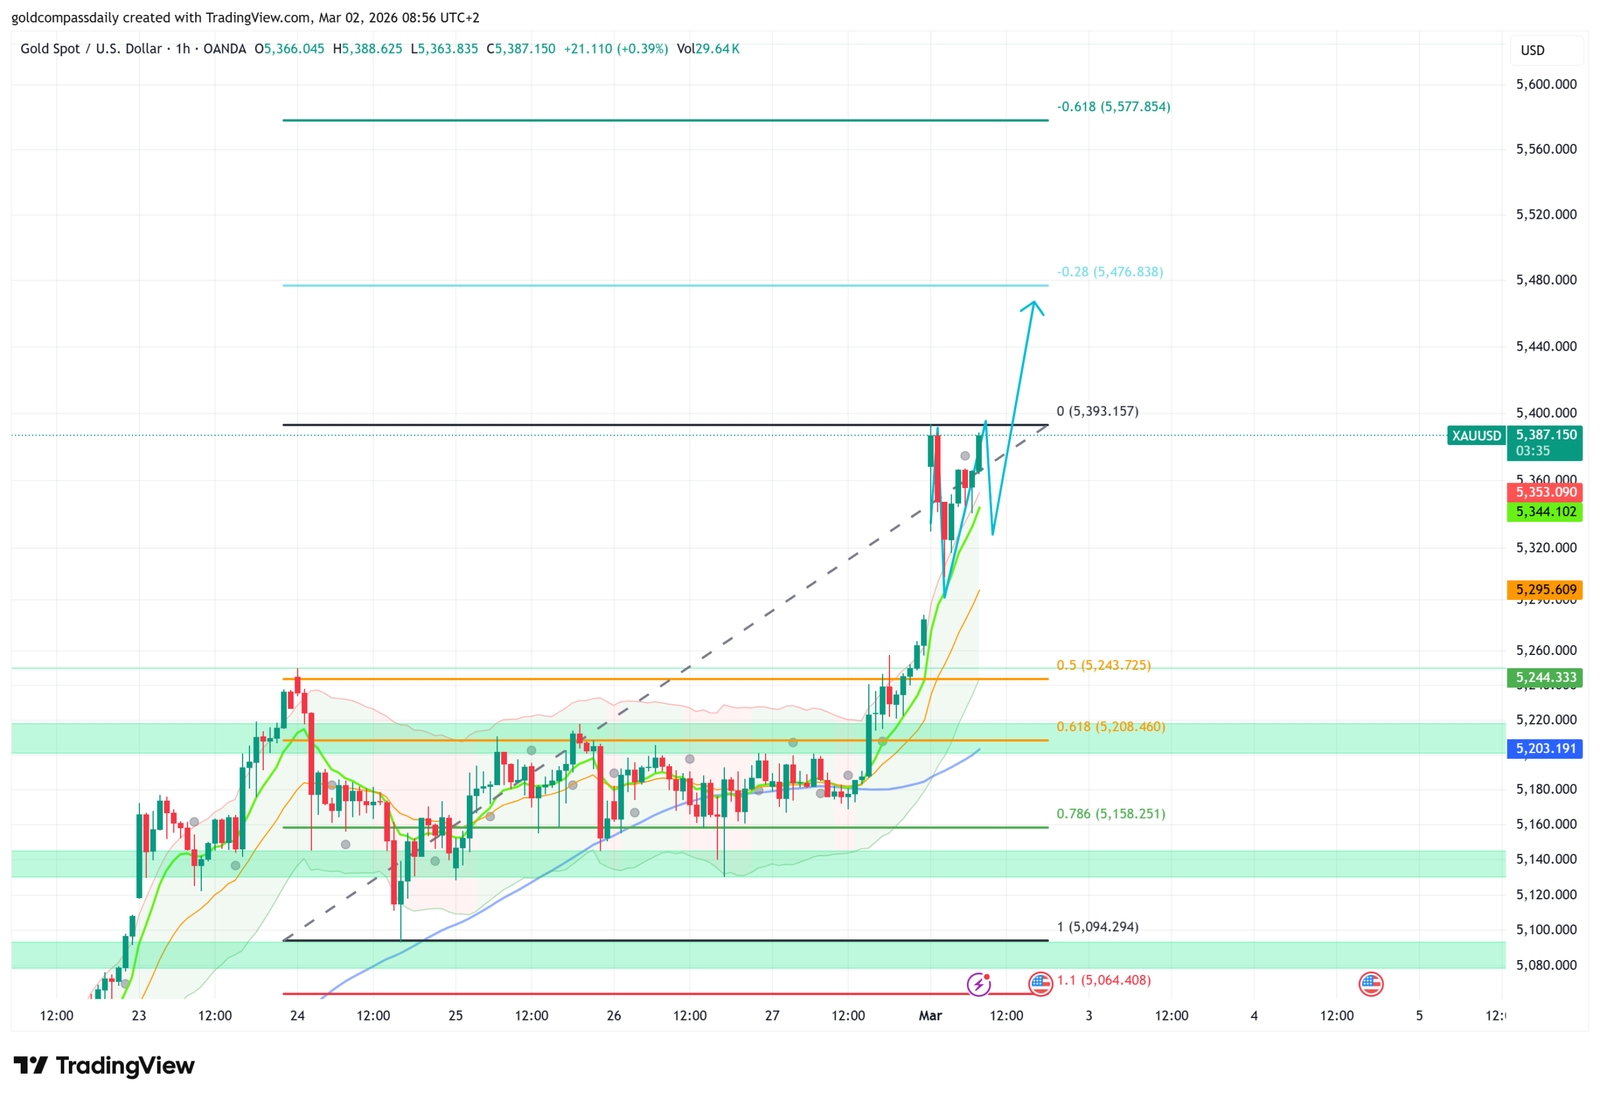
As we analyze the current 1-hour chart, the technical map has shifted toward higher Fibonacci extensions. The following levels will define the trend in the coming days:
- Immediate Resistance: The 0 Fibonacci level at $5,393.157 is the final obstacle. A sustained break above this high opens the door to the -0.28 extension at $5,476.838.
- Critical Support: In the event of profit-taking, the previous resistance at $5,243.725 (0.5 Fib on the macro scale) must now hold to keep the parabolic structure intact.
- Trend Line Integrity: The diagonal trend line originating from Feb 23 remains the primary guide for the long-term trend. As long as we stay above this line, every dip is a technical buy opportunity.
The Macro Outlook: What to Expect Next
Looking ahead, the trajectory of XAU/USD is now heavily dependent on the development of the conflict in the Middle East. Technically, the market is approaching “overbought” territory, but in high-stakes geopolitical environments, technical oscillators often remain pinned at extremes for extended periods. Our primary target for the week remains the -0.618 extension at $5,577.854, provided the $5,350 level is successfully back-tested as support.
Traders should expect elevated volatility and potential “slippage” during news releases. The era of conservative $10-$20 daily ranges is over; we are now in a market where $100 moves can occur within single sessions.
Disclaimer: This weekly analysis is for educational purposes only. The current geopolitical situation makes trading extremely high-risk. Always use appropriate stop-loss orders to protect your capital.