Gold XAU/USD 4070-4020: GDP, PCE and ECB Test Support
T. S. Gospodinov
Thu, October 29, 2026 at 9:07 AM • 7 min read
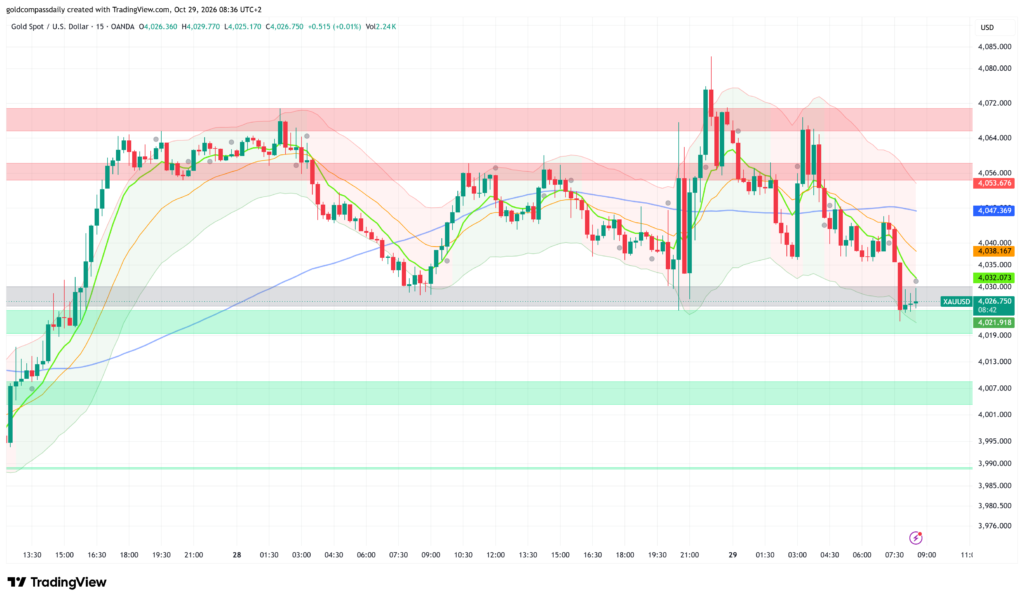
Gold trades at 4,070-4,020 – sellers hold control after the metal reversed from the 4,070 area and fell below every major moving average on the 15-minute chart. Spot XAU/USD is quoted near 4,027, and the first real test of buyers comes at 4,021.9. A dense US data release at 2:30pm and the ECB rate decision at 3:15pm will decide whether that floor holds.
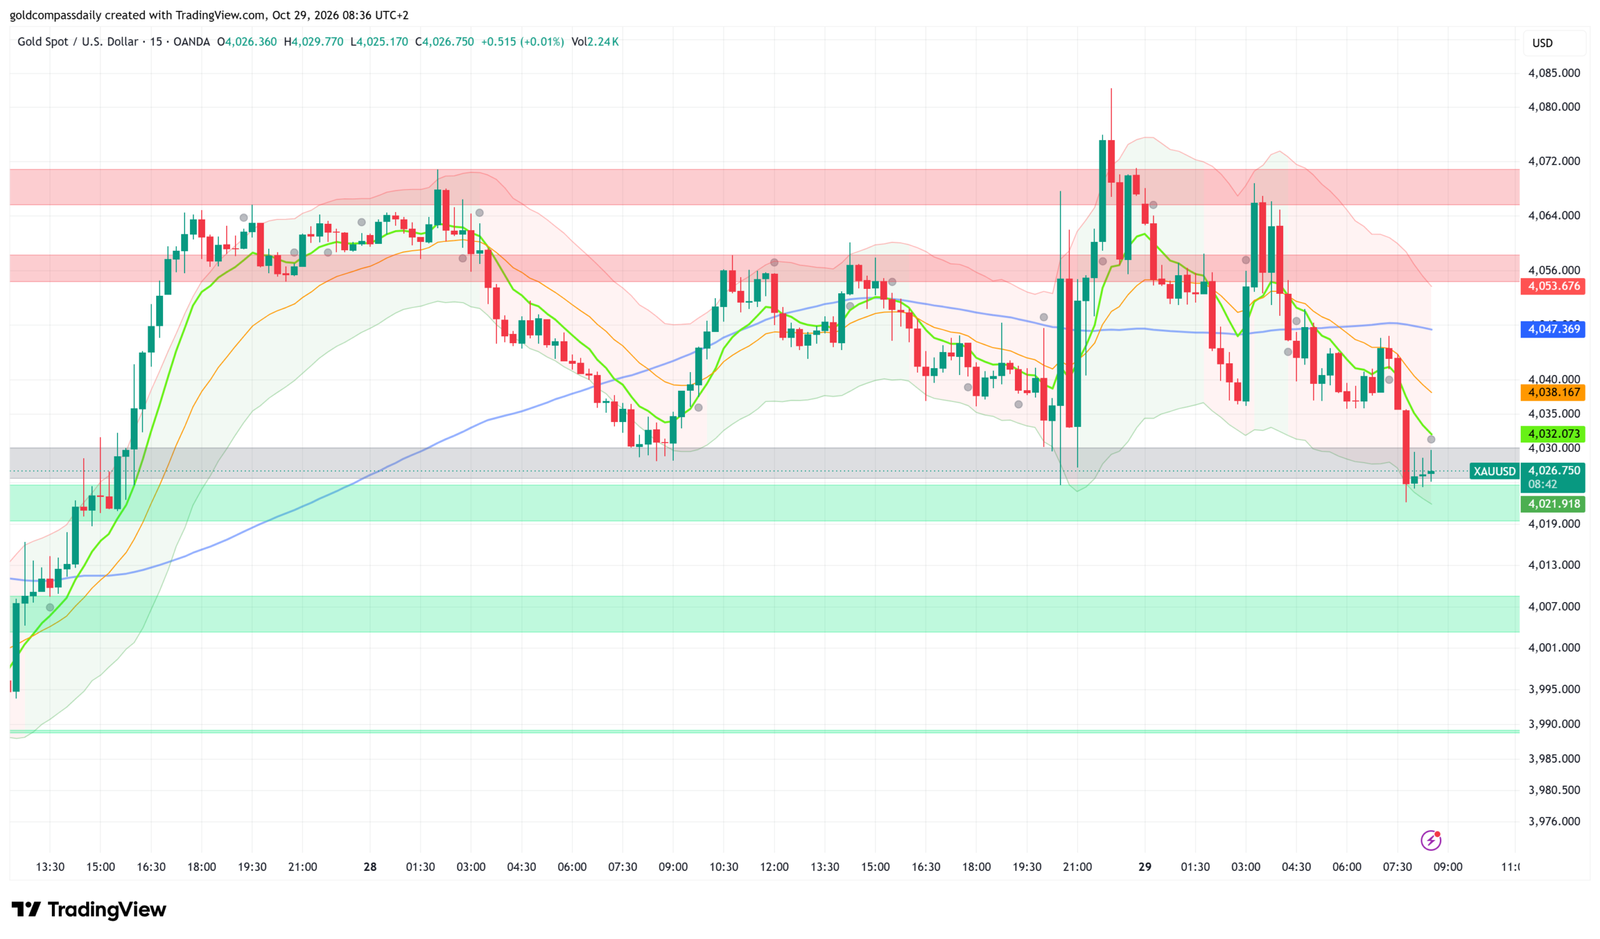
Key Levels
- Resistance 4,066-4,072: upper supply zone and the session high area
- Resistance 4,053.7: lower edge of the second supply zone
- Resistance 4,047.4: slow moving average, now sloping flat above price
- Resistance 4,038.2 and 4,032.1: fast and mid moving averages, both pointing down
- Support 4,026-4,022: current test zone, with 4,021.9 as the first line
- Support 4,007-4,013: next demand block below
- Support 3,990: lower boundary of the visible range
Catalyst of the Day
The US Advance GDP, Core PCE Price Index, Personal Income, Personal Spending and Unemployment Claims all print at 2:30pm. Advance GDP is forecast at 3.2% against 2.2% previously, and Core PCE is expected at 0.3% month on month after 0.2%. A reading at or above forecast on both lines would lift Treasury yields and the dollar, and that is the setup that has pressured gold during today’s Asian and European sessions.
Fundamental Context
The data calendar leans toward a firm US picture. Growth is forecast to accelerate by a full percentage point, and Personal Income is expected at 0.3% against 0.2% before. Unemployment Claims are projected at 198K compared with 194K, a small uptick that leaves the labor market tight. Personal Spending is the one soft spot, with a forecast of 0.6% after 0.9%.
Inflation components add a second layer. The Advance GDP Price Index is forecast at 3.2% after 6.1%, a sharp cooling in the deflator, while Core PCE is expected to tick higher. A split between those two readings would keep the dollar reaction muddled in the first minutes after 2:30pm. Gold carries no yield, so any rise in rate expectations after the release adds to the downside pressure.
The ECB follows at 3:15pm. The Main Refinancing Rate is expected to stay at 2.65%, unchanged from the prior decision, so the market reaction depends on the Monetary Policy Statement and the 3:45pm press conference. A cautious tone on further easing would support the euro and soften the dollar, which usually helps gold. A hawkish hold would do the opposite. Earlier today, Australian Import Prices fell 1.1% quarter on quarter against a 1.3% forecast, and Japanese Consumer Confidence came in at 35.0, slightly below the 35.1 forecast. Neither moved gold in a meaningful way.
Chart Analysis
Bearish momentum dominates the 15-minute chart. Price dropped from the 4,070 area into the grey zone around 4,026, and the latest red candle broke below the lower Bollinger band before a small recovery. XAU/USD trades under the 4,032 fast average, the 4,038 mid average and the 4,047 slow average, and all three slope down or flat, which confirms seller control. Each bounce since the 4,083 spike has failed at lower highs, and the 4,038 average capped the latest attempt. A sustained break under 4,026 opens the way to 4,021.9, and a close below that level exposes the 4,007-4,013 demand block.
Bull / Bear Scenarios
Bull scenario
Buyers need a defense of 4,021.9 and a softer data set, such as GDP below 3.2% or Core PCE at 0.2%. A recovery above 4,032 and then 4,038 would turn the short-term structure neutral, with 4,047 as the next target. A reclaim of 4,053.7 would put the 4,066-4,072 supply zone back in play.
Bear scenario
Hot GDP and a 0.3% or higher Core PCE would push the dollar up and pull gold through 4,021.9. Price then targets the 4,007-4,013 block, and a loss of that zone points toward 3,990. Any rally that stalls under 4,038 keeps the downtrend intact.
Events Ahead
Times are shown in UTC+2.
- 2:00am – NZD ANZ Business Confidence, actual 52.5, previous 51.9
- 2:30am – AUD Import Prices q/q, actual -1.1%, forecast 1.3%, previous 5.7%
- 7:00am – JPY Consumer Confidence, actual 35.0, forecast 35.1, previous 35.4
- 11:00am – EUR Italian Monthly Unemployment Rate, forecast 6.2%, previous 6.2%
- 11:30am – GBP M4 Money Supply m/m, forecast 0.3%, previous 0.4%
- 11:30am – GBP Mortgage Approvals, forecast 54K, previous 55K
- 11:30am – GBP Net Lending to Individuals m/m, forecast 6.2B, previous 6.9B
- Tentative – EUR Italian 10-y Bond Auction, previous 4.58
- 2:30pm – USD Advance GDP q/q, forecast 3.2%, previous 2.2%
- 2:30pm – USD Core PCE Price Index m/m, forecast 0.3%, previous 0.2%
- 2:30pm – USD Advance GDP Price Index q/q, forecast 3.2%, previous 6.1%
- 2:30pm – USD Unemployment Claims, forecast 198K, previous 194K
- 2:30pm – USD Personal Income m/m, forecast 0.3%, previous 0.2%
- 2:30pm – USD Personal Spending m/m, forecast 0.6%, previous 0.9%
- 2:50pm – CAD Gov Council Member Gravelle speaks
- 3:15pm – EUR Main Refinancing Rate, forecast 2.65%, previous 2.65%
- 3:15pm – EUR Monetary Policy Statement
- 3:45pm – EUR ECB Press Conference
- 4:30pm – USD Natural Gas Storage, forecast 75B, previous 77B
- 5:30pm – CAD Gov Council Member Vincent speaks
- 7:30pm – CHF Gov Board Member Tschudin speaks
New York Session Update
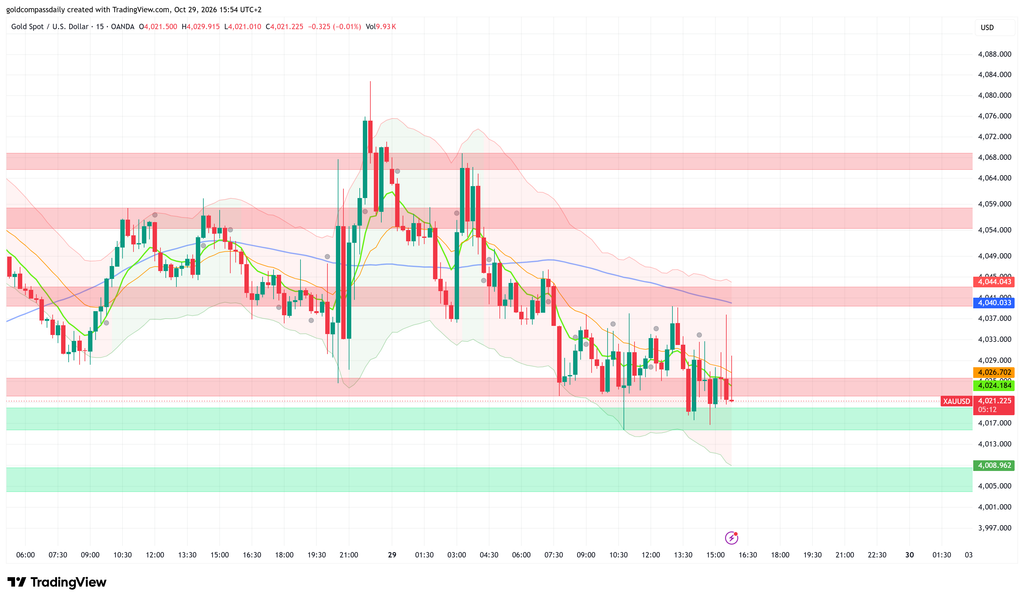
Gold trades at 4,021, so the bearish bias from Gold Compass Daily’s morning analysis has held. That analysis projected a test of 4,021.9 and a move toward the 4,007-4,013 demand block, and price has now reached the first of those levels.
What Changed
Selling pressure intensified after the New York open. Price broke decisively below the 4,026 support that held the morning session, and that level has turned into resistance. The two rebounds since the US data window both failed below 4,040, the second with a long upper wick near 4,037 that shows buyers were rejected quickly. Price is now sitting on the upper part of the green demand zone, and the 4,022-4,026 band that was support this morning is supply.
Updated Levels
- Current price: $4,021
- Bias now: bearish, unchanged. The break of 4,026 confirms the morning thesis and no recovery above the fast and mid moving averages has appeared.
- Updated support: $4,016-$4,020 (green zone), then $4,009
- Updated resistance: $4,026-$4,027 (broken support and mid moving average), then $4,040-$4,044
- NY session target: $4,009
Scenarios Into the Close
Bull: a 15-minute close back above 4,027 would end the immediate selling and open a rebound toward 4,040. Bear: a close below 4,016, the bottom of the green zone, would send price toward 4,009 and the demand block beneath it.
Chart Analysis
The 15-minute chart shows a clear downtrend from the 4,083 spike, with lower highs at roughly 4,069 and 4,038 and price now at 4,021. All three moving averages sit above price: the fast average at 4,024.2, the mid average at 4,026.7 and the slow average at 4,040.0, which is sloping down. That ordering confirms seller control. A stack of supply sits overhead, starting with the red band at 4,022-4,026, then 4,040-4,044, then 4,054-4,059 and 4,066-4,069. Price is far below the slow average, so any bounce has to cover a wide gap before meeting real resistance. The lower Bollinger band is expanding downward, which shows momentum is still with sellers. The green zone at 4,016-4,020 has absorbed the last two dips, including the wick to about 4,016 around 10:30, but each rebound from it has been weaker. The projected path is a break of that zone and a move to 4,009, which matches the levels from the input. A failed break would produce a bounce to 4,026-4,027 first.
Disclaimer: The information on Gold Compass Daily is provided for general informational and educational purposes only and does not constitute financial, investment, trading or legal advice. Trading gold, forex, indices, equities and cryptocurrencies carries a high level of risk and can result in the loss of your entire capital. Leveraged products are not suitable for every investor. Past performance does not guarantee future results. Price levels, forecasts and scenarios are opinions based on the data available at the time of writing and may change without notice. Readers should do their own research and consult a licensed financial advisor before making any trading or investment decision. Gold Compass Daily accepts no liability for any loss or damage arising from the use of this content.
Economic Calendar
Disclaimer
The content on Gold Compass Daily is provided for educational and informational purposes only. It does not constitute financial, investment, tax, or legal advice.