

Gold trades at $4,086 after the price plunged to the $4,082 level during the Asian session. The metal broke below the 15-minute moving averages around 06:00 and has stayed under pressure since, with sellers in control of the short-term structure.
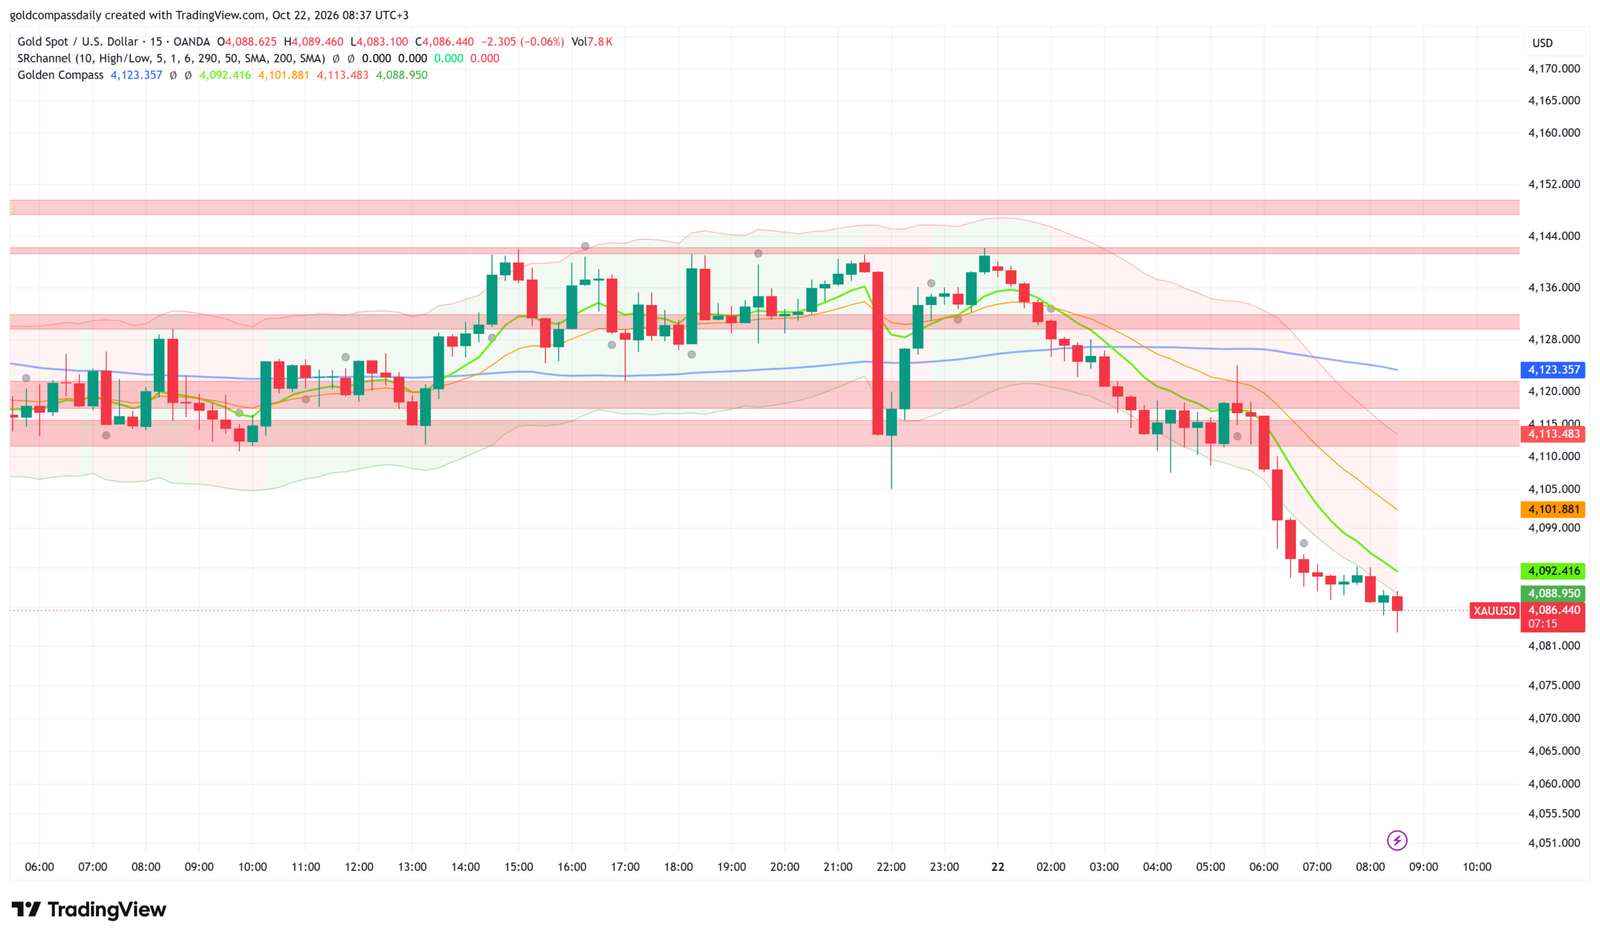
Key Levels
- Resistance 3: $4,123 (200 SMA)
- Resistance 2: $4,113 (upper channel and former support zone)
- Resistance 1: $4,101 and $4,092 (moving averages, immediate overhead cap)
- Current price: $4,086
- Support 1: $4,082 (Asian session low)
- Support 2: $4,075
- Support 3: $4,070
Catalyst of the Day
The US weekly Unemployment Claims report at 3:30pm GMT+3 is the main scheduled risk for gold today. The market expects 200K against a prior reading of 199K. A print above forecast would point to a softer labor market and could give gold a lift, while a lower figure would support the dollar and extend the current slide.
Fundamental Context
Gold spent most of the previous session in a tight range between $4,110 and $4,142, with repeated rejections near the upper edge. The sharp drop around 21:45 broke that balance, and the Asian session turned the move into a sustained decline.
Macro data across the calendar is mostly secondary today. New Zealand CPI came in at 0.8% quarterly against a prior 1.5%, a soft reading that has little direct effect on gold. The Swiss National Bank publishes its Summary of Monetary Policy Discussions, and Canadian producer price data follows in the afternoon. US Leading Index and Natural Gas Storage figures close out the session.
For the broader setup that led into this week, see the earlier note on the test of the 200 SMA ahead of UK CPI. The price that was holding at $4,123 then now sits about $37 below that level.
Chart Analysis
On the 15-minute chart, the price plunged to the $4,082 level during the Asian session. The move carried gold below both short-term moving averages and into the lower band of the channel, with the 4,092 and 4,101 averages now sloping down and acting as overhead resistance. The recent candles are small-bodied, which shows selling momentum fading near $4,082. A minor consolidation is likely to follow during the London session, probably between $4,082 and $4,092, before the next directional move.
Bull / Bear Scenarios
Bullish case: A recovery above $4,092 and a hold over $4,101 would signal that the Asian selloff has run its course. That opens a path back to the $4,113 zone, where the channel resistance sits. A weak US claims print would add fuel to such a rebound.
Bearish case: A clean break below $4,082 puts $4,075 and $4,070 in play. With the moving averages pointing lower and no recovery above $4,092, sellers keep the advantage. A claims figure at or below 199K would strengthen the dollar and raise the odds of a deeper drop.
Events Ahead
- 10:30am CHF: Summary of Monetary Policy Discussions
- 1:00pm GBP: CBI Industrial Order Expectations, forecast -20, previous -9
- 3:30pm CAD: IPPI m/m, forecast 0.9%, previous 1.3%
- 3:30pm CAD: NHPI m/m, forecast -0.1%, previous -0.1%
- 3:30pm CAD: RMPI m/m, forecast 3.1%, previous 3.1%
- 3:30pm USD: Unemployment Claims, forecast 200K, previous 199K
- 5:00pm EUR: Consumer Confidence, forecast -17, previous -17
- 5:00pm USD: CB Leading Index m/m, forecast -0.1%, previous -0.1%
- 5:30pm USD: Natural Gas Storage, forecast 83B, previous 67B
Disclaimer
The content on Gold Compass Daily is provided for educational and informational purposes only. It does not constitute financial, investment, tax, or legal advice. Nothing on this website should be interpreted as a recommendation to buy or sell any financial instrument, including gold, stocks, cryptocurrencies, or indices.
Trading and investing involve significant risk of loss. Past performance is not indicative of future results. You should conduct your own research and consult with a qualified financial professional before making any investment decisions.
Gold Compass Daily and its authors are not responsible for any losses or damages incurred as a result of using the information provided on this site.