
Gold trades cautiously bullish at $4,319.54 — price is consolidating inside a key demand zone following a sharp V-shaped recovery from last week’s lows near $4,076. The immediate structure favours continuation higher, contingent on the $4,307–$4,322 support band holding through today’s US session catalysts. For context on the week’s macro setup, see the Gold Week Ahead: June 15–19 hub article.
Key Levels
- Bias: Bullish above $4,307
- Support: $4,307–$4,322 → $4,240
- Resistance: $4,329 → $4,340–$4,343 → $4,355–$4,366 → $4,374
- Session target: $4,340 (conditional on $4,307 holding and ADP not shocking to the upside)
- Invalidation: Break and close below $4,307 opens $4,240; below $4,220 negates the bullish structure entirely
Catalyst of the Day
The primary catalyst for Tuesday’s session is US ADP Weekly Employment Change, released at 15:15 UTC+3. Unlike the monthly ADP report, this weekly figure captures real-time labour market conditions ahead of Wednesday’s FOMC decision — a meeting at which the Fed is expected to hold rates. A weaker-than-expected ADP print would reinforce the case for eventual rate cuts, applying downward pressure on the US dollar and providing direct upside fuel for gold. A strong print, by contrast, would tighten the Fed’s policy timeline and could compress any breakout attempt above $4,340. Watch whether the number prints above or below the prior reading of 29,000.
Fundamental Context
China’s data released overnight delivered a broadly deflationary picture that supports gold’s safe-haven bid. Retail Sales contracted 0.6% year-on-year against an expectation of -0.3%, while Fixed Asset Investment fell 4.1% year-to-date against a forecast of -2.3%. For gold, deteriorating Chinese domestic demand signals that Beijing may be compelled to ease monetary or fiscal policy further — historically a environment that lifts demand for hard assets. Industrial Production at 4.5% slightly beat expectations, but the headline domestic consumption numbers dominate the macro narrative.
Both the Bank of Japan and the Reserve Bank of Australia held rates unchanged overnight, as expected. Neither decision materially shifts the gold outlook in isolation. However, the BOJ’s continued reluctance to tighten — despite inflation persistence — keeps the yen soft and reinforces the global easy-money backdrop that has underpinned gold’s rally from $4,076 to the current $4,319 zone. The G7 summit entering Day 2 adds an element of geopolitical headline risk; any escalation in language around trade or sanctions would add incremental support to gold’s bid. Monday’s session analysis covering the Lagarde speech backdrop is available here.
Chart Analysis
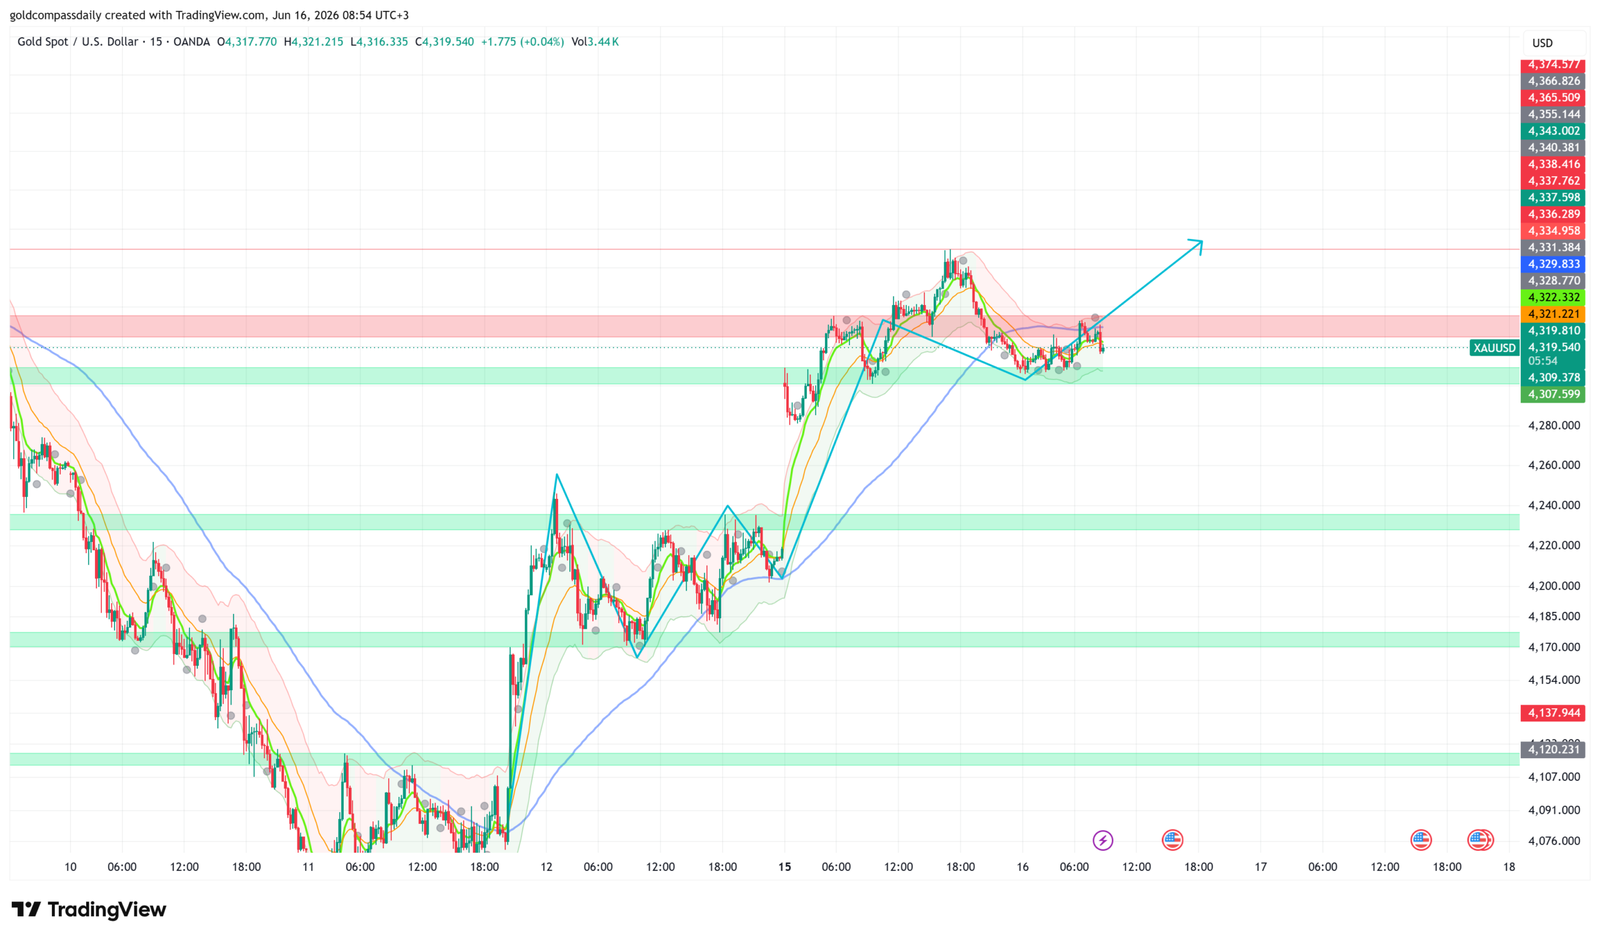
The 15-minute chart shows XAU/USD completing a clean V-shaped recovery from the $4,076 low printed on June 11–12, with a near-vertical rally leg that extended to the $4,340–$4,343 resistance cluster. Price is now in a bull flag / descending channel consolidation pattern, pulling back into the pink demand zone at $4,307–$4,322. The short-term EMA stack remains bullishly configured — all moving averages are curled upward beneath price, and the price is trading above the 200 EMA, confirming the macro trend is intact. The chart’s projected path — marked by the blue arrow — targets a breakout continuation toward $4,340 and then $4,374. The structure invalidates on a sustained close below $4,307; the next meaningful support cluster sits at $4,240, followed by the deeper demand zone at $4,170–$4,185.
Bull / Bear Scenarios
Bull trigger: Price holds $4,307–$4,322 through the European session and ADP prints at or below 29K → momentum re-engages above $4,329, targeting $4,340 intraday and $4,366–$4,374 as the extended session target.
Bear trigger: ADP prints significantly above prior (40K+) and price breaks and closes below $4,307 on the 15-minute chart → near-term downside toward $4,240, with the bullish thesis under review below $4,220.
Events Ahead This Week
- Tue Jun 16, 12:00 UTC+3 — German ZEW Economic Sentiment (exp. -5.8): An improvement from -10.2 would strengthen EUR and weaken USD, marginally supportive for gold.
- Tue Jun 16, 15:15 UTC+3 — ADP Weekly Employment Change (prev. 29K): Primary intraday catalyst — see Catalyst section above.
- Tue Jun 16, 15:30 UTC+3 — US Import Prices m/m (prev. 1.9%): A cooling print supports the disinflation narrative and reduces pressure on the Fed to hold restrictive — bullish for gold.
- Tue Jun 16, 15:30 UTC+3 — US Building Permits (exp. 1.42M): Secondary housing data; matters if it meaningfully misses, adding to USD weakness.
- Wed Jun 18 — FOMC Rate Decision: The week’s dominant risk event. Any dovish pivot in language — or a downgraded dot plot — is the catalyst that could drive XAU/USD through $4,374 and toward the $4,400 handle.
Gold Compass Daily maintains a bullish bias on XAU/USD so long as $4,307 holds on a closing basis. The ADP figure at 15:15 UTC+3 is the session’s decision point — a soft number confirms the setup, while a strong print demands patience ahead of Wednesday’s FOMC.
New York Session Update
Gold has broken decisively above the morning’s primary resistance cluster, with price printing $4,350.58 — confirming the bullish thesis outlined in Gold Compass Daily’s morning analysis and clearing the $4,340–$4,343 resistance zone that defined the session’s first trigger point.

What Changed
The morning’s $4,307–$4,322 demand zone held without being tested, with buyers absorbing the Asian session consolidation and launching a clean breakout through $4,340 during the early New York overlap. Price subsequently extended to a high of $4,354.87, establishing a new intraday channel between $4,340 and $4,400. The $4,374 resistance level flagged in the morning analysis has been absorbed into the mid-channel structure rather than acting as a ceiling, shifting the focus to $4,382 and the $4,400 handle as the next meaningful supply cluster.
Updated Levels
- Current price: $4,350.58
- Bias: Bullish — unchanged and strengthened; price is trading above all morning resistance levels
- Updated support: $4,340–$4,343 → $4,328
- Updated resistance: $4,355 → $4,366 → $4,382 → $4,400
- NY session target: $4,374–$4,382 (with $4,400 as the extended target on momentum continuation)
Scenarios Into the Close
Bull: Price holds above $4,340 on any pullback and reclaims $4,355 → continuation toward $4,382–$4,400 into the New York close.
Bear: A sustained break back below $4,340 on elevated volume signals a channel breakdown → retest of $4,328, with $4,309 as the deeper support if selling accelerates.
Chart Analysis
The 15-minute chart confirms a textbook bull flag resolution — price broke above the descending channel flagged in the morning update and has since established a rising structure within a new $4,340–$4,400 channel. The short-term EMA stack remains tightly bullish, with all moving averages fanned upward beneath price and the 200 EMA well below current levels, providing no near-term overhead friction from the moving average structure. The blue projected path on the chart points directly toward the $4,374–$4,382 supply band, consistent with the updated resistance hierarchy. A green demand zone at $4,340–$4,343 now acts as the key intraday floor; so long as price closes 15-minute candles above this level, the channel structure and the bullish continuation thesis remain intact.
Analysis based on the XAU/USD 15-minute chart as of June 16, 2026, 08:54 UTC+3. This article is for informational and educational purposes only and does not constitute financial advice.