
Successful institutional trading isn’t about predicting the future; it’s about aligning timeframes. This blueprint outlines how to combine our 4-hour macro structure with 5-minute liquidity execution to capitalize on Gold’s move toward the $5,000 milestone.
Step 1 – Defining the HTF Bias (The 4H Anchor)
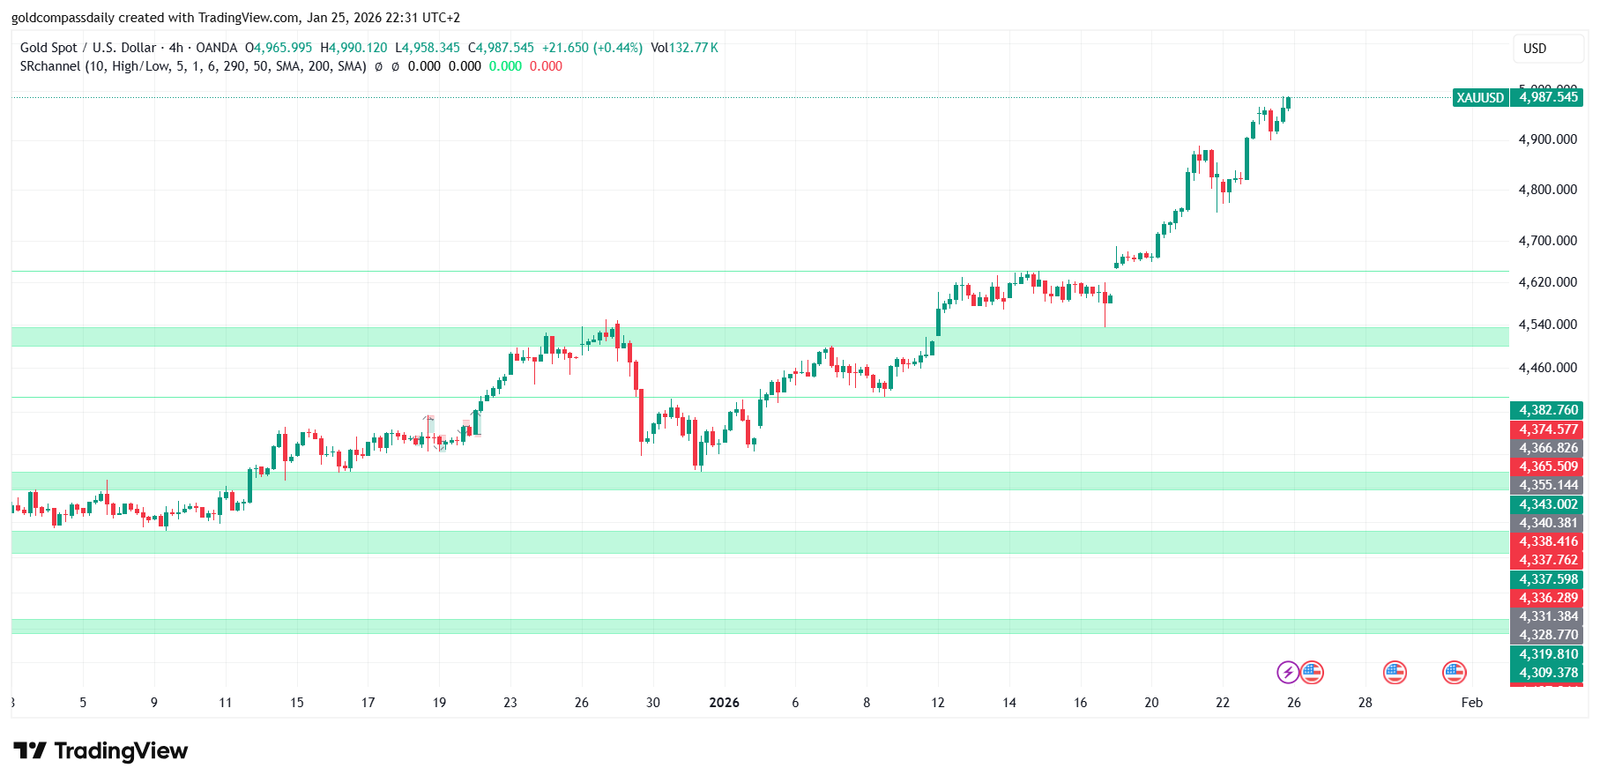
Our Gold Investment Strategy 2026 begins with the 4-hour chart. As seen in our macro analysis, the trend is parabolic. We only look for long positions as long as the price holds above the $4,800 structural support. The “Green Belts” on the 4H chart are our zones of high-interest for capital allocation.
Step 2 – Locating Intraday Liquidity (The 5M Trigger)
Once the macro bias is confirmed, we drop to the 5-minute timeframe to find the “Engine”. We don’t buy blindly. We wait for the market to sweep internal sell-side liquidity (SSL). Look for the price to dip into the $4,970 – $4,975 demand zones identified on our intraday map before looking for a reversal sign.
Step 3 – The Execution Checklist
To qualify as a “Golden Compass” trade, the following criteria must be met:
- HTF Alignment: Price must be above the 4H EMA or within a Green Support Belt.
- Liquidity Sweep: A clear hunt of previous session lows (Judas Swing).
- MSS (Market Structure Shift): A break of the last lower high on the M5 chart with strong displacement.
Risk Management & Scaling
In this high-volatility environment, capital preservation is key. We recommend a “Fixed-Fractional” risk model. Stop-losses should be placed below the 4H structural lows ($4,946 or $4,912), while take-profit targets are set at the $4,990 supply zone and the $5,000 psychological expansion.
Blueprint Rule: Never risk more than 1% of your equity on a single liquidity sweep. Let the macro trend do the heavy lifting.