While traditional charts show us where the price has been, Order Flow shows us the battle between buyers and sellers in real-time. To trade Gold like an institution, you must understand the concept of “Imbalance”—the moment when one side of the market completely overwhelms the other.
What is an Order Flow Imbalance?
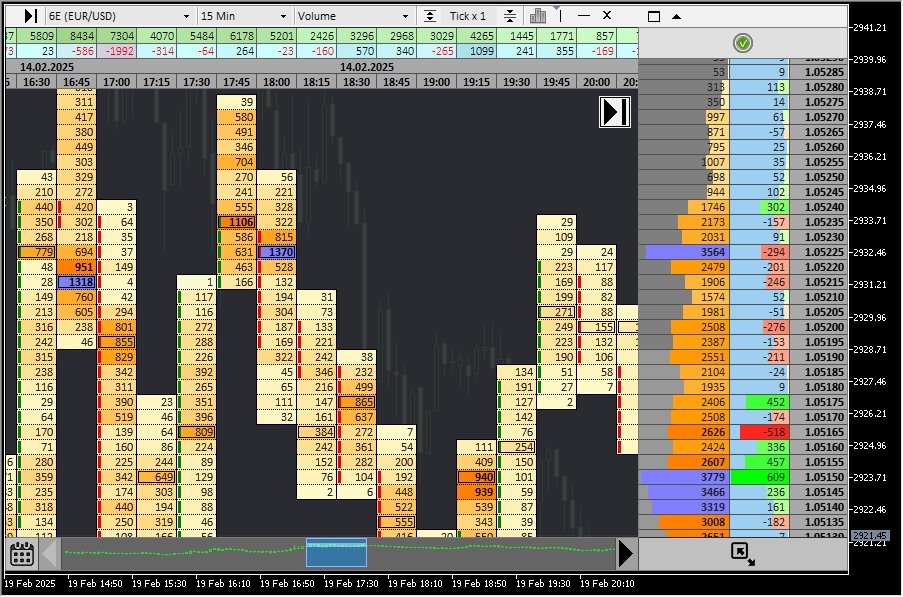
An imbalance occurs when the aggressive market orders (the “hitters” of the bid or ask) are significantly higher than the passive limit orders on the opposite side. In our Order Flow Analysis for Gold, we look for a minimum of 300% difference between buying and selling volume at a specific price level to confirm institutional activity.
Reading the Delta
Delta is the net difference between aggressive buy orders and aggressive sell orders.
- Positive Delta: Indicates aggressive buying (buying at the ask).
- Negative Delta: Indicates aggressive selling (selling at the bid).
When we see Gold approaching a 4-hour liquidity zone with an extreme positive delta that suddenly “traps,” it’s often a sign of a looming reversal.
Trapped Traders and Absorption
Absorption is a key Order Flow phenomenon where a large institutional limit order “soaks up” all aggressive market orders. If you see price hitting a resistance level with high buying delta but the price refuses to move higher, you are witnessing Absorption. This is a classic “Short” signal for professional traders.
Pro Tip: Always combine Order Flow imbalances with your 4H Macro structure. An imbalance in the middle of nowhere is noise; an imbalance at a $4,970 support zone is a signal.