

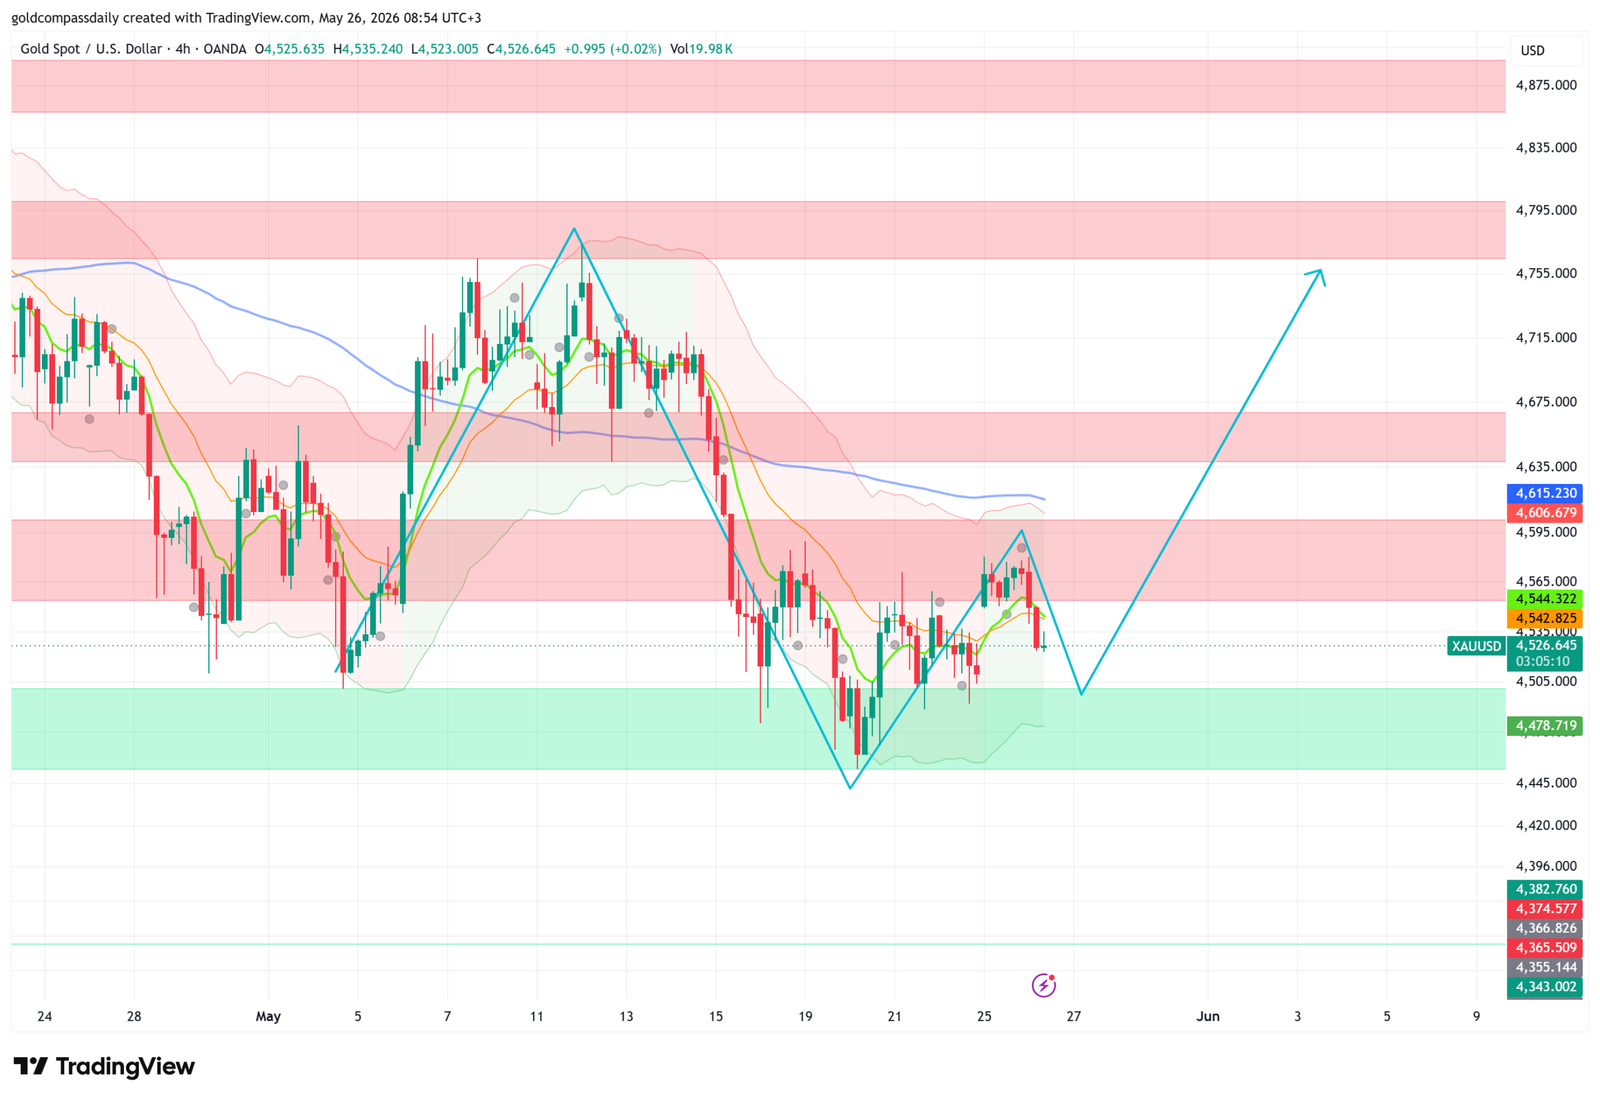
Gold enters the week of May 26 at a technically significant juncture. After testing the $4,447 low last week — the deepest correction since the post-FOMC collapse in March — XAU/USD has recovered to $4,526 and is now consolidating within the green demand zone between $4,478.719 and $4,544.322. The 4-hour chart projects one more dip to $4,478 before a recovery toward $4,755+ — a move that would represent the most significant single-week advance for gold since the April rally. Whether that move materialises depends on a calendar that is one of the most consequential of the quarter: RBNZ and Australian CPI on Wednesday, US Prelim GDP and Core PCE on Thursday, and a Friday that delivers French GDP, German unemployment, Spanish CPI, Canadian GDP, and US Goods Trade Balance simultaneously. This is the week that tells us whether the global stagflation signal confirmed by last week’s PMI collapse translates into the data that forces central banks to act.
The Context: What Last Week Established
The week of May 18–23 delivered a coherent and consistent narrative across every major data point. French services PMI collapsed to 42.9 — a reading outside COVID-era lows. UK services PMI fell from 52.7 to 47.9 in a single month. Australian employment shed 18,600 jobs against expectations of a 16,700 gain. The Eurozone services PMI dropped to 46.4. FOMC Minutes revealed more internal dovish debate than the post-meeting communication had suggested. UK CPI missed at 2.8% while UK PPI Input accelerated to 2.4% — the tariff inflation is in the pipeline, not yet in consumer prices.
Gold absorbed all of this without breaking to new lows — the $4,447 low held the green demand zone and the recovery since has been orderly. The 4-hour chart shows a market that is building a base rather than continuing lower. The structural bull case — tariff inflation, global growth deceleration, eventual Fed easing, safe-haven demand — has not weakened. It has been reinforced by every data point of the past two weeks. This week’s data will determine whether that structural case begins translating into a sustained directional move higher.
Monday, May 25 — Memorial Day: US Markets Closed
US markets are closed for Memorial Day. Switzerland, France, and Germany are also on bank holiday — making Monday the thinnest liquidity day of the week. Canadian markets are closed as well. Price action on Monday will be driven by Asian session flows and any G7 or geopolitical headlines from the weekend rather than by scheduled data. The thin liquidity creates conditions for exaggerated intraday moves that do not necessarily reflect genuine directional conviction — any Monday move above $4,544 or below $4,478 should be assessed with caution until US liquidity returns Tuesday.
The one meaningful release is the Canadian Corporate Profits q/q at 3:30pm — expected at -2.0% (prior -1.6%). A continued decline in Canadian corporate profitability adds to the picture of a North American economy feeling tariff pressure in earnings before it shows up in employment data.
Tuesday, May 26 — UK Retail Sales, US Consumer Confidence, BOJ Core CPI
Tuesday is the week’s first full liquidity session and delivers several tier-one inputs. The morning opens with the BOJ Core CPI y/y at a tentative time (prior 1.7%) — the Bank of Japan’s preferred inflation measure. Given last week’s Japanese manufacturing PMI hold at 54.5 and the trade balance surplus beat, any BOJ CPI reading above 1.8% would accelerate the BoJ normalisation timeline and strengthen the yen — dollar-negative and gold-supportive through the currency channel.
At 1:00pm, UK CB Realized Sales (prior -68) — a survey of UK retailers’ actual sales experience, which will be the first post-PMI-collapse read on whether UK consumer activity is as bad as the services PMI suggested. A reading worse than -68 would confirm the UK services contraction was reflecting real spending deterioration rather than survey pessimism bias.
At 4:00pm: S&P/CS Composite-20 HPI y/y (prior 0.9%) and HPI m/m (prior 0.0%) — US housing price data. These are backward-looking indicators that rarely move gold directly but add context to the housing market stress narrative visible in Building Permits and Housing Starts data.
The afternoon’s primary event is US CB Consumer Confidence at 5:00pm (forecast 91.9, prior 92.8). Consumer confidence at 91.9 would be a marginal deterioration from last month and a continuation of the trend that has seen US consumer sentiment decline from above 105 in February to the low 90s. A reading below 88 — below the April low — would be a genuine shock that signals Liberation Day tariff uncertainty has crossed the threshold into consumer spending behaviour change. A beat above 95 would be the most positive US macro signal of the week and would temporarily support the dollar.
Wednesday, May 27 — RBNZ Rate Decision, Australian CPI, FOMC Speakers
Wednesday is the week’s most event-dense single day. It opens in the Asia-Pacific session with two major central bank and inflation inputs that will set the global tone for Thursday’s critical US data.
The RBNZ Official Cash Rate decision at 5:00am is expected to hold at 2.25% (prior 2.25%). The accompanying Monetary Policy Statement and press conference at 6:00am are the market-moving outputs. New Zealand faces a specific challenge from Liberation Day tariffs: as a small, highly trade-dependent economy with close ties to both the US and China, the tariff shock hits through multiple channels simultaneously. Any signal from the RBNZ that cuts are coming faster than previously indicated would be NZD-negative and risk-off — adding to the global central bank easing wave that is gold’s structural tailwind.
Australian CPI at 4:30am is the week’s most important inflation release for the Asia-Pacific region. CPI m/m forecast 0.6% (prior 1.1%), CPI y/y forecast 4.4% (prior 4.6%), Trimmed Mean CPI m/m forecast 0.3% (prior 0.3%), Construction Work Done q/q (prior -0.1%). After last week’s employment shock (-18.6K jobs) and the RBA’s hold at 4.35%, the CPI reading will determine whether the RBA can cut in June. A CPI y/y below 4.3% — below forecast — would make a June cut near-certain and weaken the AUD. A reading above 4.6% — above the prior — would complicate the picture: falling employment + rising inflation = the Australian version of the global stagflation signal.
At 3:15pm: ADP Weekly Employment Change (prior 42.3K) — the pre-claims employment signal. The prior reading of 42.3K was already weak; a second consecutive sub-50K reading would reinforce the NFP deceleration narrative heading into next week’s official payrolls.
At 4:00pm: Richmond Manufacturing Index (forecast 4, prior 3) — US regional manufacturing expected to hold just above zero. In the context of last week’s Philly Fed miss (1.40 vs 17.6 forecast), any Richmond reading below zero would be the second consecutive regional manufacturing contraction signal in a month.
At 5:00pm: US CB Leading Index m/m (prior -0.2%) — the Conference Board’s composite forward-looking indicator. A third consecutive negative reading would confirm that the US economy’s leading indicators have been pointing to slowdown for a full quarter.
Two FOMC members speak Wednesday: Logan at 10:55pm and Cook at 3:55pm. Their framing of last week’s PMI data and the European growth shock will signal whether the Fed is updating its assessment of the global spillover risks.
Thursday, May 28 — The Week’s Defining Day: Prelim GDP, Core PCE, Claims
Thursday is the single most data-intensive session of the week and one of the most important days of the entire month for gold. The release sequence at 3:30pm is extraordinary in its concentration:
Prelim GDP q/q forecast 2.0% (prior 0.7%). The second estimate of Q1 US GDP — expected to show significant upward revision from the first estimate. A reading of 2.0% would be a substantial beat versus the prior 0.7% and would be the most significant US economic resilience signal available this month. However, Q1 GDP was largely compiled before Liberation Day’s full impact — the number reflects January-March activity, not the post-April tariff shock. Markets will interpret a strong Q1 GDP with caution: it confirms prior strength but provides little guidance on Q2 trajectory.
Core PCE Price Index m/m forecast 0.3% (prior 0.3%) — the Federal Reserve’s preferred inflation measure. A reading in line with forecast maintains the current trajectory. A beat above 0.4% would reignite hawkish Fed concerns. A miss below 0.2% would be the most dovish US inflation signal since the series began decelerating and would significantly accelerate cut timeline pricing — the most gold-bullish outcome available Thursday.
Unemployment Claims forecast 211K (prior 209K) — essentially unchanged from last week’s reading. Two consecutive weeks in the 209–211K range would signal that last month’s 189K anomalously low reading was the outlier and that the labour market is actually running at 210K+ — a more modest but still-resilient pace. A reading above 225K would be the first clear evidence of Liberation Day’s employment impact and would be the most gold-positive labour market signal of the month.
Prelim GDP Price Index q/q forecast 3.8% (prior 3.7%) — the GDP deflator. An acceleration to 3.8% confirms that economic growth is increasingly nominal rather than real — the stagflation signal that gold’s bull case requires.
Additionally at 3:30pm: Core Durable Goods Orders m/m (forecast 0.5%, prior 0.9%), Durable Goods Orders m/m (forecast 4.0%, prior 0.8%), Personal Income m/m (forecast 0.4%, prior 0.5%), Personal Spending m/m (forecast 0.5%, prior 0.7%). The personal income and spending data alongside Core PCE creates a simultaneous picture of the American consumer: are they spending through the uncertainty, or are declining confidence readings translating into actual expenditure restraint?
Thursday also brings the ECB Monetary Policy Meeting Accounts at 2:30pm — the detailed record of the May ECB meeting — and ECB President Lagarde speaks at 10:20am. Given last week’s French services PMI collapse to 42.9 and the German manufacturing return to contraction, Lagarde’s assessment of Q2 economic conditions will determine whether June ECB cut pricing moves to near-certainty. Three FOMC members speak Thursday: Jefferson at 12:10am, Williams at 3:55pm, and Barkin at 10:00pm.
Friday, May 29 — Month-End: European GDP, German Unemployment, Spanish CPI, Canadian GDP
Friday is month-end — a day when positioning flows can amplify data-driven moves in either direction. The European morning delivers a comprehensive Q1 growth assessment across the major economies alongside the first May inflation readings.
French Prelim GDP q/q at 9:45am (forecast 0.0%, prior 1.0%) — France is expected to have stagnated in Q1 after a strong Q4. Zero growth alongside a services PMI at 42.9 and collapsing consumer spending would confirm that the French economy was already decelerating before Liberation Day.
German Unemployment Change at 10:55am (forecast 11K, prior 20K) — an expected improvement in Germany’s unemployment claims. If confirmed, it would be a modest positive for EUR/USD. A miss above 20K would signal that last month’s deterioration was not an anomaly.
Spanish Flash CPI y/y at 10:00am (forecast 3.3%, prior 3.2%) — a slight expected acceleration. Spain has been the Eurozone’s persistent inflation outlier and any reading above 3.5% would complicate the ECB’s June cut narrative significantly.
Canadian GDP m/m at 3:30pm (forecast 0.1%, prior 0.2%) — a deceleration in Canadian monthly growth. Combined with last week’s corporate profits miss (-2.0%), the Canadian economy is clearly feeling tariff pressure before the official BOC assessment acknowledges it.
US Goods Trade Balance at 3:30pm (forecast -$86.5B, prior -$87.9B) — a slight expected improvement in the US trade deficit. Any significant widening above $90B would be the political catalyst for further tariff rhetoric from the Trump administration.
BOE Governor Bailey speaks at 11:20am — his second appearance this week after Thursday’s UK Flash PMI collapse. Friday’s speech will be his opportunity to signal the BOE’s June decision direction explicitly. A dovish Bailey who acknowledges the services PMI deterioration as sufficient to justify a June cut would be GBP-negative but globally supportive for risk assets. Friday also brings Chicago PMI at 4:45pm (forecast 50.6, prior 40.2) — an expected significant improvement in Chicago manufacturing after last month’s anomalously weak reading.
The Week’s Key Levels for Gold
- Current price: $4,526
- Green demand zone (floor): $4,478.719 — hold this to keep the recovery structure intact
- Dip target before recovery: $4,478 — chart projects one more test of this level
- Resistance sequence: $4,544.322 → $4,565 → $4,595–$4,606 → $4,635 → $4,675
- Primary weekly target: $4,755+ — requires Thursday’s Core PCE miss or Claims beat
- Bull case trigger: Australian CPI below 4.3% (Wed) + Core PCE below 0.2% (Thu) + Claims above 225K (Thu) = break above $4,635 toward $4,755
- Bear case risk: US GDP 2.0% beat + Core PCE above 0.4% + Claims below 200K = break below $4,478 → $4,374–$4,382 tested
- Month-end close to watch: Above $4,635 = bullish May close setting up June continuation · Below $4,478 = correction extends
The Week’s Verdict Before It Begins
Gold at $4,526 is not a weak market. The $4,447 low held. The recovery has been orderly. The structural drivers — tariff inflation confirmed in PPI data across three continents, global services sector contraction visible in synchronised PMI data, central bank easing waves building across Europe and Asia-Pacific — have not reversed. What has kept gold from moving higher is the persistent resilience of US labour market data relative to the deteriorating forward-looking indicators.
This week resolves that tension. Thursday’s Core PCE and Prelim GDP will tell us whether the US economy’s Q1 strength is carrying into Q2 or whether the leading indicators have been right all along. If Core PCE misses and Claims rise, the Fed’s higher-for-longer narrative loses its last pillar — and gold’s path to $4,755 opens immediately. If both beat, the correction may need one more leg before the next bull run begins. Either way, the direction of the next significant move for gold will be determined between 3:30pm and 5:00pm on Thursday, May 29.
You can see last week’s analysis here.
Analysis based on the XAU/USD 4-hour chart as of May 26, 2026, 08:54 UTC+3. Economic data sourced from the weekly macro calendar. This article is for informational and educational purposes only and does not constitute financial advice.