

Gold breaks below $4,400 as Australian household spending collapses and the market positions for today’s simultaneous release of US GDP, Core PCE, and Unemployment Claims at 3:30pm.
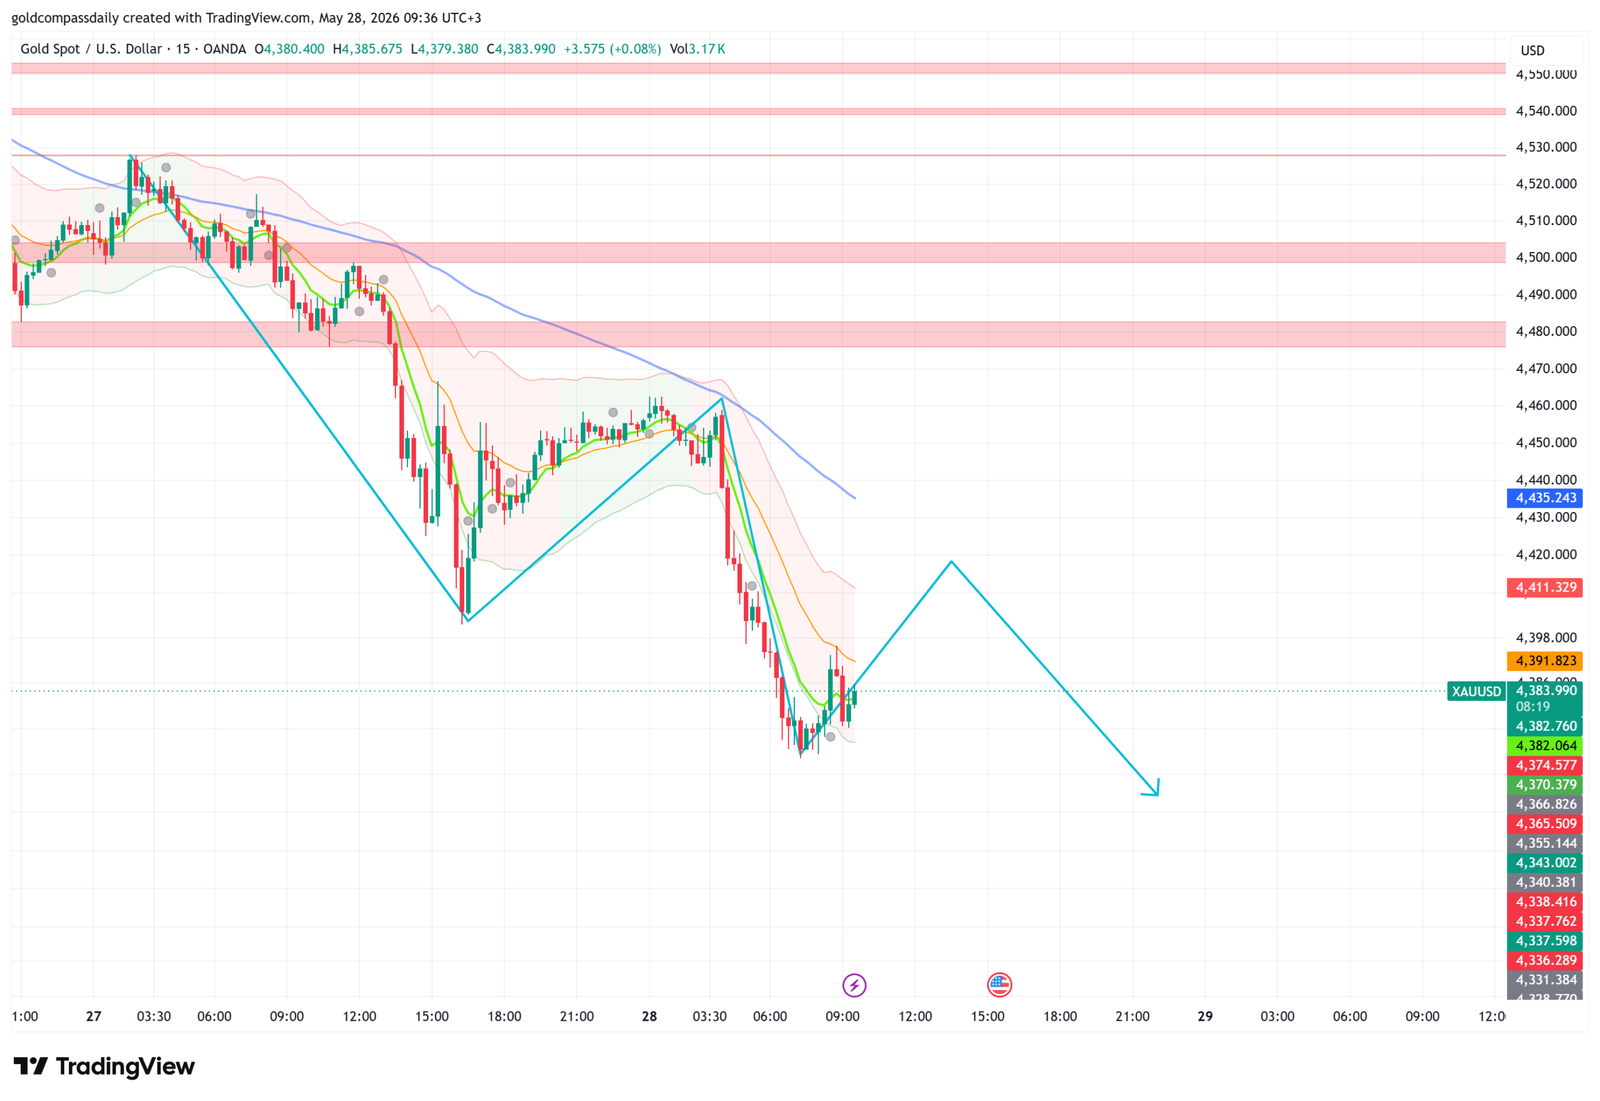
XAU/USD is trading at $4,383 — a level not seen since late April — after a sustained selloff broke through the $4,477 support that had defined the week’s floor and accelerated through the green demand zone on no single dominant catalyst but on the accumulation of a week’s worth of disappointments: Memorial Day thin-liquidity weakness, BOJ CPI miss, Australian consumer spending collapse, and dollar resilience as US data has consistently held above recessionary thresholds. The 15-minute chart projects a dip to $4,370.379 before a potential reversal, but the direction of the next significant move — up or down by $80–$120 — will be written at 3:30pm when Prelim GDP, Core PCE, Unemployment Claims, Personal Income, Personal Spending, and Durable Goods all print simultaneously. This is the week’s defining moment, and today’s session exists in anticipation of it. For the full weekly context, see the Gold Week Ahead: May 26–30.
The Fundamental Driver: Australian Data Splits — Consumer Collapses, Business Invests
Australian Household Spending m/m printed at -1.1% — dramatically below the forecast of -0.5% and the prior 1.6%. Australian consumers cut spending by 1.1% in a single month — the largest monthly consumer pullback since the COVID-era lockdowns. The data arrives one day after the CPI miss (4.2% y/y vs 4.4% forecast) and last week’s employment shock (-18.6K jobs), completing the most consistently negative sequence of Australian economic data in recent memory. The Australian consumer is not slowing — they are retracting. For the RBA, June cut is no longer a probability — it is a near-certainty, and the discussion has shifted to whether June should be the first of a rapid sequence rather than an isolated adjustment.
The counterpoint is significant. Australian Private Capital Expenditure q/q at 6.5% — a dramatic beat against the forecast of 1.2% and the prior 0.7%. Australian businesses increased capital spending by 6.5% in Q1 — the strongest quarterly business investment reading in years. The divergence between consumer behaviour (collapsing) and business behaviour (aggressively investing) creates the same paradox visible in UK data this week: wage earners are cutting spending while businesses are expanding capacity. The most likely explanation is sectoral: business investment is concentrated in mining, energy, and infrastructure — sectors responding to commodity cycle dynamics rather than consumer demand — while household spending reflects the rate pain felt by mortgage holders. For gold, the business investment beat is modestly dollar-positive through AUD strength, partially offsetting the safe-haven demand from consumer collapse.
The broader Asia-Pacific picture this morning reinforces the global growth concern theme. FOMC Member Goolsbee spoke at 5:25am — his assessment of the accumulating global weakness data will have been closely watched for any signal that the Fed is shifting its internal calculus ahead of today’s 3:30pm data. ECB President Lagarde speaks at 10:10am — her commentary on the ECB Monetary Policy Meeting Accounts (due at 2:30pm) will frame the European session’s interpretation of whether the ECB’s June cut is the beginning of a cycle or a one-time adjustment.
The Chart: $4,374–$4,382 Is the Last Line Before $4,343
The 15-minute chart has broken through every support level that defined this week’s structure. The $4,477 floor is gone. The pink band at $4,480 is gone. The $4,411.329 level visible on the chart has been tested and is now acting as resistance rather than support. Price is consolidating at $4,382–$4,383 — the green demand band that has been the structural floor since the April recovery began. This is not a level to be casual about: the green bands at $4,374.577, $4,370.379, and $4,366.826 have held on every approach since March. A close below $4,366 on a 15-minute basis would be the clearest technical breakdown signal of the entire correction — opening the $4,343 and $4,337 levels below.
The projected path shows one more dip to $4,370.379 — completing the current leg lower — before a recovery toward $4,411.329 (first resistance) and then $4,435.243. That recovery is conditional on today’s 3:30pm data providing a dovish signal. A Core PCE miss below 0.2% or a Claims reading above 225K would be the specific triggers. A Prelim GDP beat above 2.5% combined with Core PCE at or above 0.3% would extend the decline through $4,366 toward the deeper green bands at $4,343.
Secondary Data: ECB Accounts, SNB Schlegel, BOC
At 2:30pm, the ECB Monetary Policy Meeting Accounts will provide the detailed internal debate from the May ECB meeting — a meeting where the committee held rates at 2.15% but signalled June cuts. Any revelation of more unanimous dovish intent than the public communication suggested would be EUR-negative and dollar-positive — adding a marginal headwind for gold ahead of the 3:30pm US data. SNB Chairman Schlegel speaks at 2:00pm — his assessment of the franc’s safe-haven strength and any intervention language would move USD/CHF. The franc has strengthened significantly through the week’s risk-off moves; any SNB pushback against CHF appreciation would be mildly dollar-positive. The BOC Financial System Review at 5:00pm and BOC Press Conference at 6:00pm provide the Canadian monetary policy context after yesterday’s RBNZ hold.
3:30pm — The Week’s Defining Moment
Everything this week — the Australian CPI miss, the RBNZ hold, the consumer confidence deterioration, the gold selloff — has been positioning for this single data window. Eight US indicators print simultaneously at 3:30pm:
Prelim GDP q/q: forecast 2.0% (prior 0.7%). A reading of 2.0% would confirm Q1 US growth was significantly stronger than the initial estimate — but markets will immediately discount it as pre-Liberation Day data that tells us nothing about Q2. A miss below 1.5% would be more market-moving: it would mean the US economy was already slowing in Q1 before the tariff shock, making the Q2 trajectory even more concerning.
Core PCE Price Index m/m: forecast 0.3% (prior 0.3%). The Fed’s single most important inflation gauge. A reading at or below 0.2% is the most gold-bullish outcome available today — it would simultaneously weaken the dollar (Fed can cut sooner) and validate gold’s inflation hedge narrative (deflation risk returning). A reading above 0.4% is the most gold-bearish: it would reignite hawkish Fed concerns at a moment when gold is already testing critical support. The 0.3% forecast is the neutral outcome — minimal directional move, technical levels hold the decision.
Unemployment Claims: forecast 211K (prior 209K). Two consecutive weeks in the 209–211K range would confirm the labour market is running at a level consistent with Fed patience rather than urgency. A reading above 225K today — crossing the threshold that would represent genuine labour market deterioration — would be the single most gold-positive outcome available at 3:30pm. A reading below 200K would extend the dollar’s strength and send gold through $4,366.
Personal Spending m/m: forecast 0.5% (prior 0.9%). After yesterday’s Australian household spending collapse at -1.1%, a US personal spending deceleration from 0.9% to 0.5% would add to the global consumer pullback narrative. A miss below 0.2% would be the most dramatic US consumer signal since the Liberation Day announcement.
Durable Goods Orders m/m: forecast 4.0% (prior 0.8%). A 4.0% beat would be driven largely by aircraft orders — a notoriously volatile component. The Core Durable Goods m/m (forecast 0.5%, prior 0.9%) is the more stable and watched measure. A core miss below 0.2% would signal business investment is stalling under tariff uncertainty — the same signal visible in Australian household data this morning.
The combined read at 3:30pm will deliver gold’s direction for the rest of the week. The three scenarios:
Dovish data package (Core PCE ≤0.2% OR Claims ≥225K OR GDP ≤1.5%): Gold recovers from $4,383 through $4,411 toward $4,435–$4,500 range. The correction low may be $4,370. Month-end Friday positioning amplifies the move higher.
Neutral data package (all readings near forecast): Gold consolidates between $4,366 and $4,411. The technical setup into Friday’s month-end determines the close. No new directional signal.
Hawkish data package (Core PCE ≥0.4% AND GDP ≥2.5% AND Claims ≤200K): Gold breaks below $4,366 toward $4,343 and $4,337. The April recovery may be retesting its starting point before the next bull leg can begin. Month-end selling into a weak close would compound the pressure.
Key Levels
- Current support: $4,382.064 → $4,374.577 → $4,370.379 (dip target)
- Critical floor: $4,366.826 — close below this opens $4,343.002
- Resistance: $4,391.823 → $4,411.329 → $4,435.243 → $4,480 (pink band)
- 3:30pm bull trigger: Core PCE ≤0.2% OR Claims ≥225K → $4,411 immediate, $4,435 next
- 3:30pm bear trigger: Core PCE ≥0.4% AND Claims ≤200K → $4,366 break, $4,343 next
- Bias: Bearish below $4,391 ahead of data — all scenarios conditional on 3:30pm print
- Full weekly context: Gold Week Ahead: May 26–30
Yesterday’s analysis called $4,477 as the floor and warned that a close below it would open $4,447. That break happened — and price went further, to $4,383. The structural support now is the April recovery’s foundation: the green demand bands at $4,374–$4,382 that have held since the post-FOMC collapse bottomed in late March. If these hold today, the week closes with gold finding its floor. If they break, the correction is deeper than the technical structure suggested, and June’s trading begins from a lower base. Today at 3:30pm, Core PCE and Claims write the answer. For context on how we got here, see yesterday’s analysis.
Analysis based on the XAU/USD 15-minute chart as of May 28, 2026, 09:36 UTC+3. Economic data sourced from the daily macro calendar. This article is for informational and educational purposes only and does not constitute financial advice.