
Welcome to today’s Gold Compass Daily. The Asian session has delivered a historic moment: Gold has decisively broken the $5,000 barrier. As we transition into the European and New York sessions, we analyze the structural shifts across three timeframes.
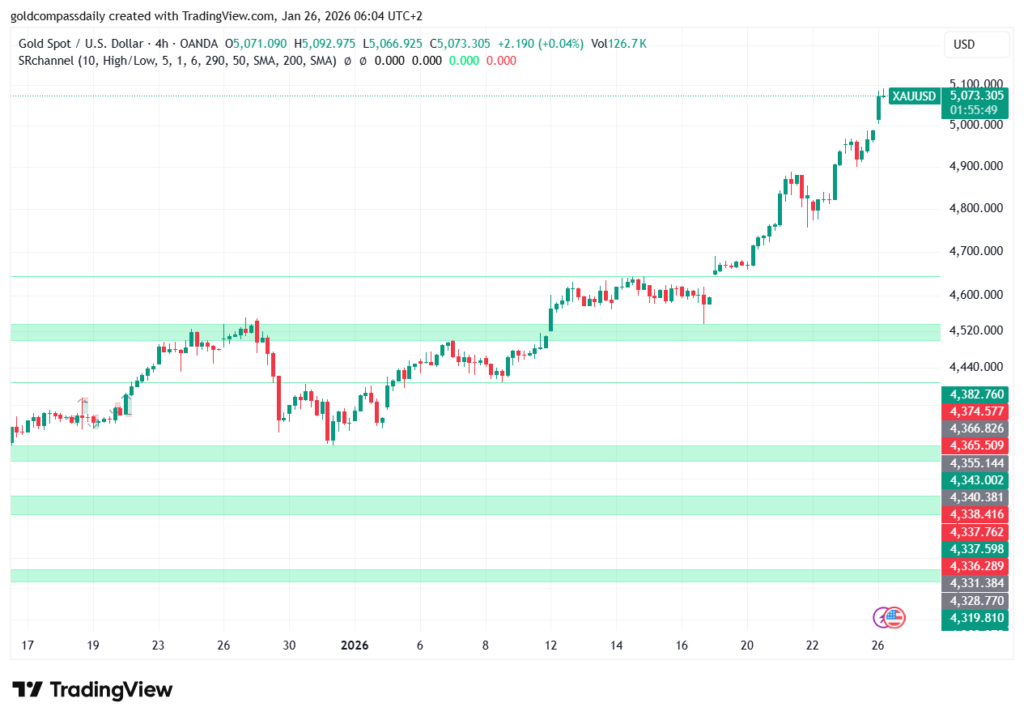
Macro Perspective (4H Chart)
The 4-hour chart confirms a massive structural breakout. After years of anticipation, the $5,000 psychological resistance has been invalidated. The price is currently exploring new highs near $5,075. On a macro scale, we are no longer looking for “if” Gold will rise, but “where” the next base will form. We expect the $5,000 – $5,020 area to act as institutional “Buy-Side” liquidity in the coming days.
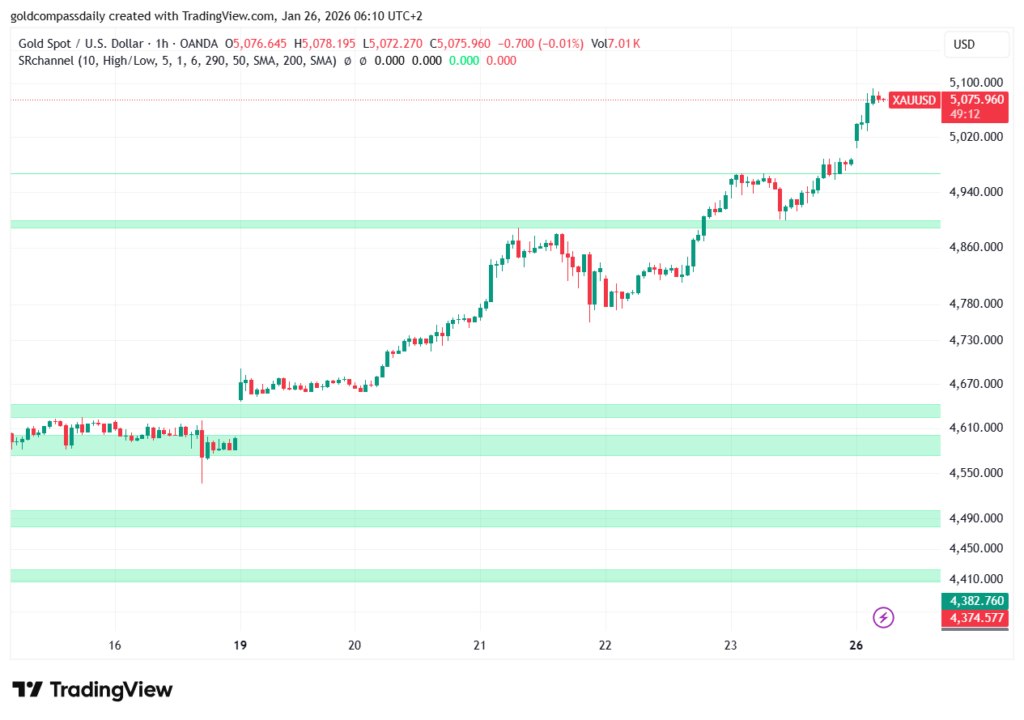
Mid-Term Liquidity (1H Chart)
On the 1-hour timeframe, we see the formation of a bullish flag pattern. Significant liquidity is resting at $5,040. For the London session, watch for a potential “Stop Hunt” into this zone before a continuation toward $5,100. The momentum remains strongly bullish, supported by a significant increase in volume during the breakout candles.
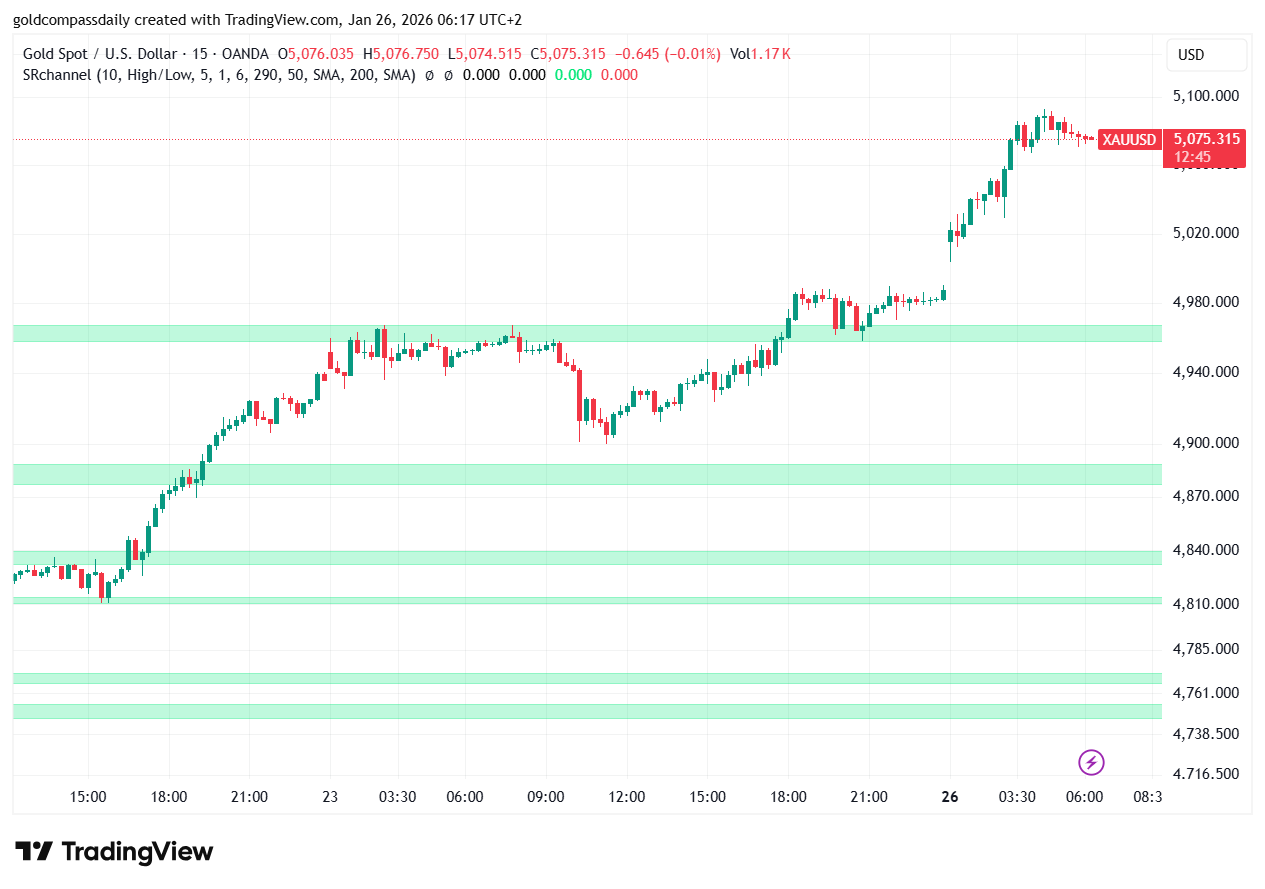
Intraday Execution (15M Chart)
For scalpers and day traders, the 15-minute order flow is key. We are observing a supply/demand flip at $5,060. Short-term imbalances are being filled, providing low-risk entry opportunities for those targeting the next extension.
- Primary Support: $5,040
- Intraday Pivot: $5,060
- Target 1: $5,085
- Target 2: $5,120
Daily Verdict: The trend is extremely bullish. We maintain a “Buy the Dip” stance as long as the price holds above the $5,000 handle. Avoid shorting into this historic momentum.