
The 4-hour (4H) chart for Gold (XAU/USD) is currently painting a textbook bullish picture for early 2026. As seen in our latest technical setup, the price action has decisively cleared previous resistance zones, turning the $5,000 psychological level into a distant memory and a rock-solid foundation for the current rally.
The Path to $5,100: Analyzing the 4H Channels
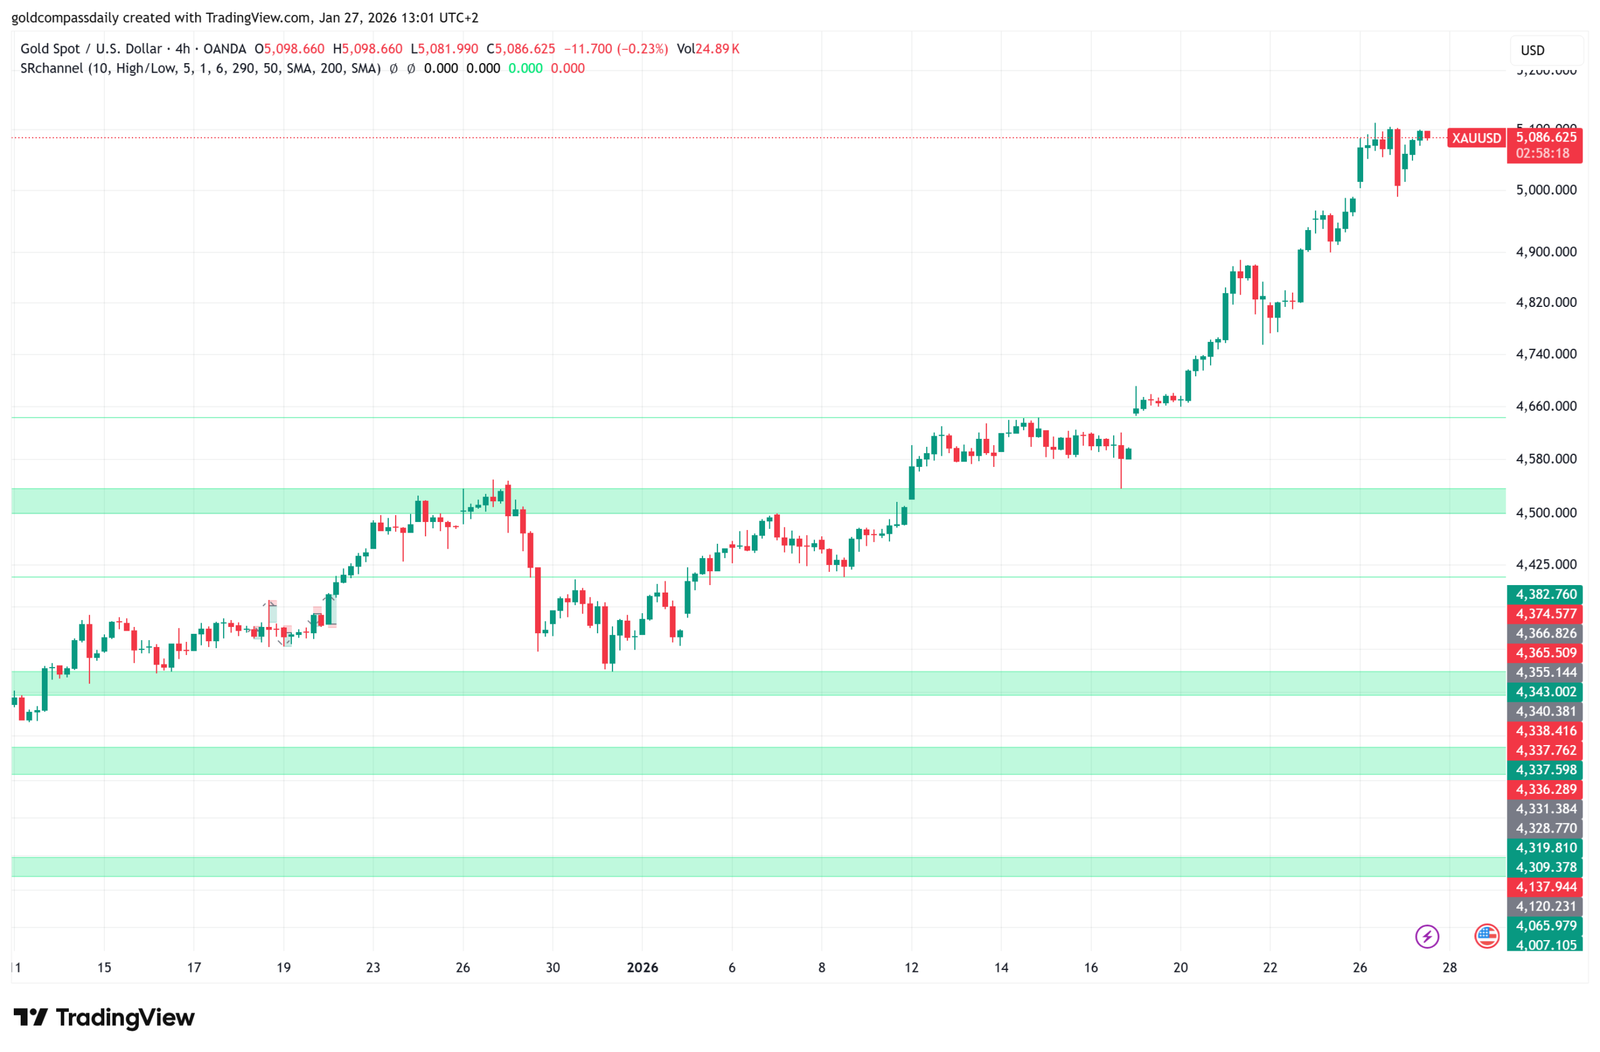
Looking at the 4H timeframe, Gold is navigating a well-defined ascending channel. Each minor correction has been met with significant buying volume, indicating that institutional interest remains high. The recent consolidation near $5,086 suggests that the market is gathering strength for a final push toward the $5,100 major resistance.
Key Technical Indicators on the 4H:
- Trend Structure: Higher highs and higher lows dominate the chart, with the price comfortably above the 50 and 200-period SMAs.
- Immediate Resistance: $5,095 – $5,100. A daily close above this zone could trigger a massive liquidity event.
- Primary Support: $5,065. As long as the 4H candles close above this mark, the macro-bullish thesis remains fully intact.
For traders looking at the “big picture,” the current 4H structure suggests that we are not just in a rally, but in a structural shift. The proximity to $5,100 creates a magnetic effect on price action, often leading to increased volatility as we approach such historic milestones.
“The 4H chart doesn’t lie. The trend is your friend until the $5,100 bend. Watch for the New York session to provide the necessary volume for the next leg up.”
Stay tuned for our upcoming 1H momentum update and our 5M precision scalp setup to see how this macro view translates into immediate trading opportunities.