


The gold market (XAU/USD) is currently trading within a high-conviction bullish range as market participants look toward the $5,100 psychological milestone. Following a robust performance during the European session, price action remains stabilized above the $5,085 level, indicating a strong underlying demand for the precious metal.
As we transition into the North American trading session, a multi-timeframe perspective is essential for identifying potential liquidity traps and breakout confirmations. Our editorial team has prepared three distinct technical updates, ranging from long-term structural analysis to short-term execution levels.
Technical Analysis Overview by Timeframe
1. Macro Structure (4-Hour Chart)
The 4-hour outlook focuses on the broader ascending channel that has governed the price action since early January. This analysis identifies the primary support zones required to maintain the current parabolic trajectory.
2. Intraday Momentum (1-Hour Chart)
Our hourly update examines the consolidation patterns formed during the London session. This report highlights the importance of the $5,090 pivot point and its role in confirming the next impulsive move.
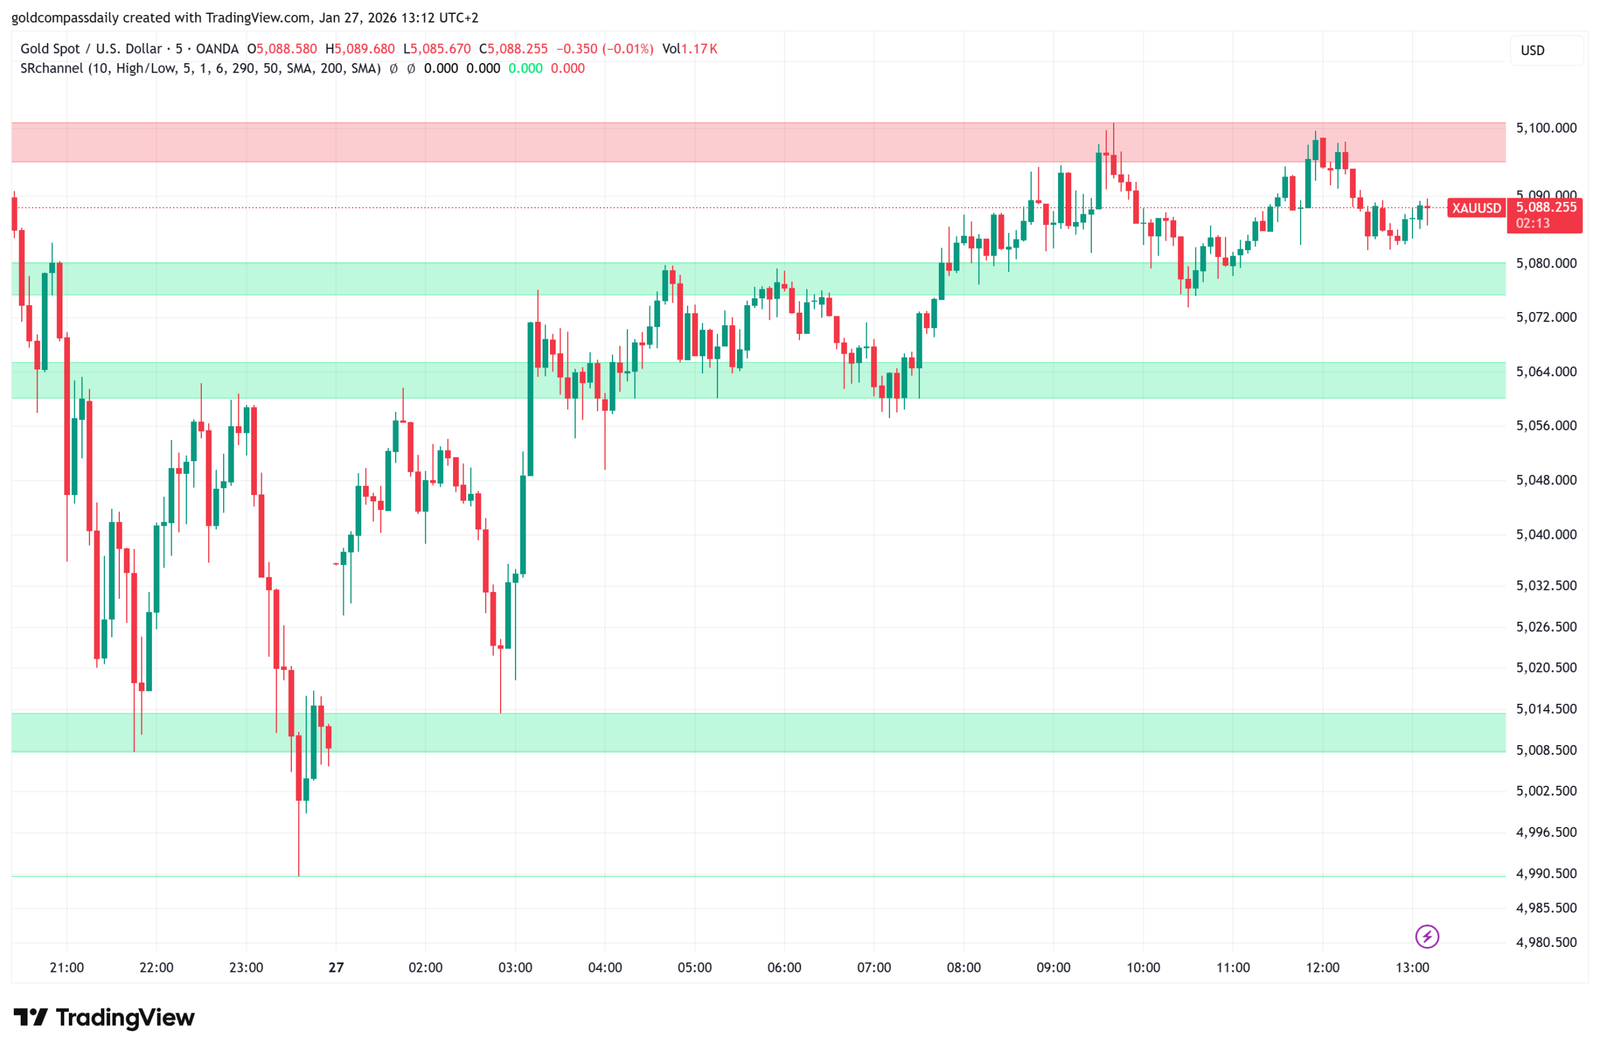
3. Execution Levels (5-Minute Chart)
Designed for active traders, the 5-minute analysis pinpoints the immediate support at $5,088 and outlines the expected volatility parameters for the New York market open.
Market Outlook Summary
The technical consensus across all timeframes remains bullish. The primary objective for buyers is a sustained breakout above the $5,095 resistance, which would likely accelerate momentum toward historical highs. Conversely, a failure to hold the $5,075 support on an hourly basis could lead to a temporary corrective phase. Investors are advised to monitor the upcoming US economic data releases for further directional catalysts.