
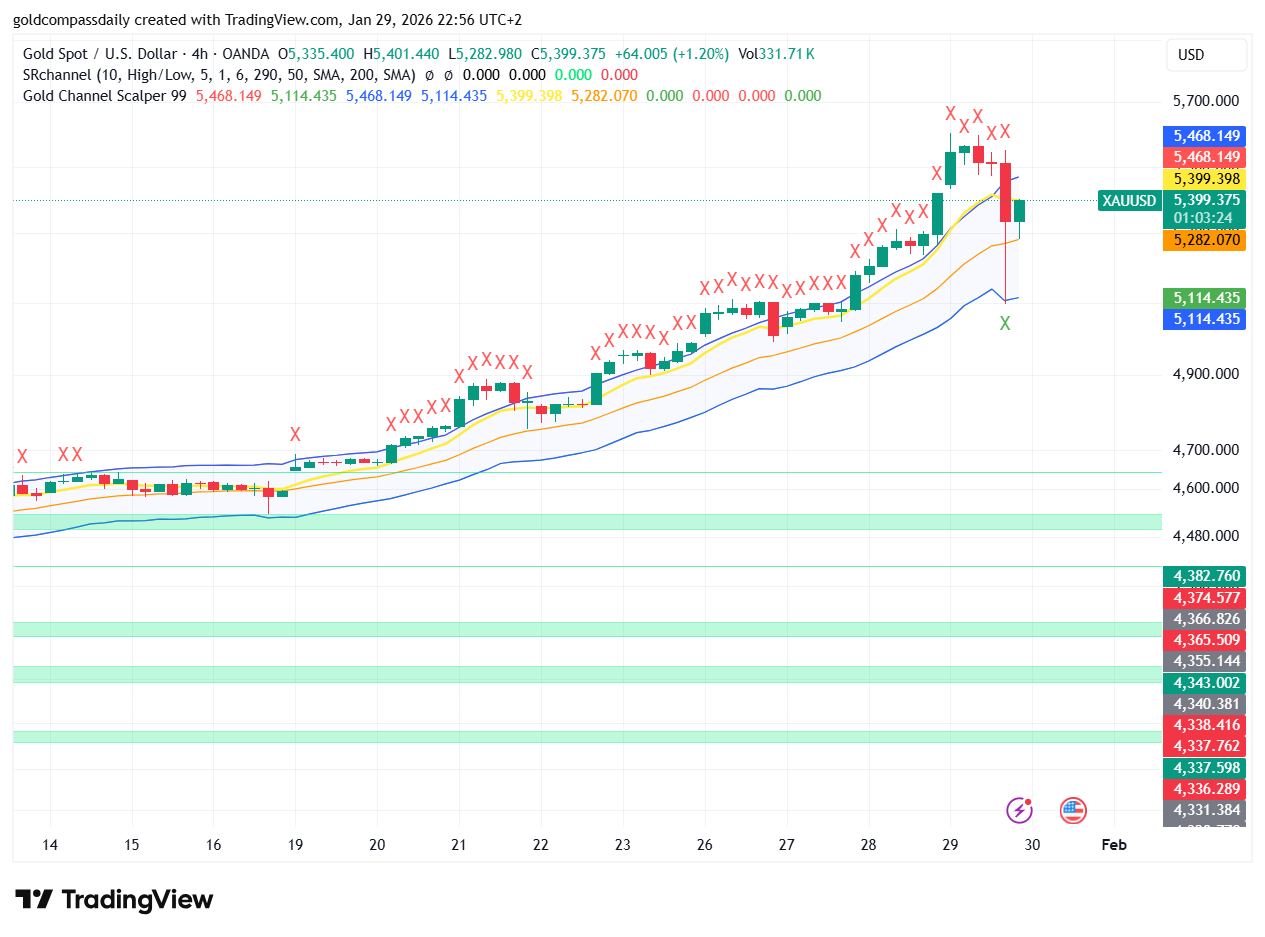
The precious metals market is currently witnessing a significant Gold Price Correction after XAU/USD reached unprecedented levels. As seen on the 4-hour chart, the bullish momentum that dominated the past week has faced a sharp rejection near the $5,468 resistance zone, leading to a localized sell-off that has caught the attention of retail and institutional traders alike.
Technical Overview: The End of the Parabolic Move?
For several days, gold maintained a strict bullish channel, supported by the 50-period Simple Moving Average (SMA). However, the latest price action shows a decisive break below the immediate support levels. This Gold Price Correction was signaled by a series of exhaustion candles (marked with ‘X’ on the chart), suggesting that buyers were losing steam at higher valuations. The current price of $5,399.375 represents a critical junction for the asset’s short-term trajectory.
The Gold Channel Scalper indicator highlights a shift in sentiment. While the long-term trend remains structurally bullish, the immediate “pullback” is testing the resolve of late-entry bulls. Looking at the volume profile, we notice a slight increase in selling pressure as the price dipped below the $5,400 psychological level.
Key Support and Resistance Levels
Identifying where the Gold Price Correction might find a floor is essential for risk management. Based on the 4-hour technical setup, here are the levels to watch:
- Immediate Resistance: $5,468.149 – This is the recent “double top” area where the price faced heavy rejection.
- Primary Support: $5,282.070 – This level aligns with previous consolidation zones and the lower boundary of the current volatility channel.
- Secondary Support: $5,114.435 – A deeper correction could lead the price toward this zone, which would represent a healthy retest of the long-term breakout point.
Fundamental Drivers Behind the Volatility
While technicals provide the roadmap, fundamental factors are the fuel. The Gold Price Correction is likely a result of profit-taking ahead of major economic data releases. Investors are closely monitoring central bank signals and geopolitical developments, which have been the primary catalysts for gold’s astronomical rise in early 2026. A stabilizing dollar and shifting yield expectations often trigger these types of corrections in a high-interest-rate environment.
Trading Strategy: Buying the Dip or Waiting for More?
For traders looking to capitalize on this Gold Price Correction, patience is key. The “wait-and-see” approach near the $5,300 level might be prudent. If the price manages to hold above the 200-period SMA, the bullish thesis remains intact. However, a daily close below $5,280 could signal a deeper retracement toward the $5,100 handle.
The ‘X’ marks on the TradingView chart indicate areas where the trend lost its linear path. Currently, we see a green ‘X’ appearing near the lower Bollinger Band, which often precedes a temporary relief rally. Traders should look for bullish engulfing patterns or RSI divergence on shorter timeframes to confirm a potential bottoming process.
Conclusion
The current Gold Price Correction is a natural part of a healthy market cycle. No asset moves in a straight line forever, and gold is no exception. By pulling back from the $5,468 highs, the market is “clearing out” overleveraged long positions, potentially setting the stage for the next leg up toward the $6,000 milestone later this year. Watch the $5,399 level closely in the next few sessions to gauge the strength of the recovery.