
The first month of 2026 has been nothing short of historic for the precious metals market. As investors grapple with a weakening dollar and shifting geopolitical landscapes, our latest Gold Price Analysis 2026 reveals a market that is both overheated and incredibly resilient. Within a single trading week, we have witnessed record highs followed by a sharp liquidation phase, providing a wealth of data for technical and fundamental traders alike.
The Anatomy of the Recent Correction
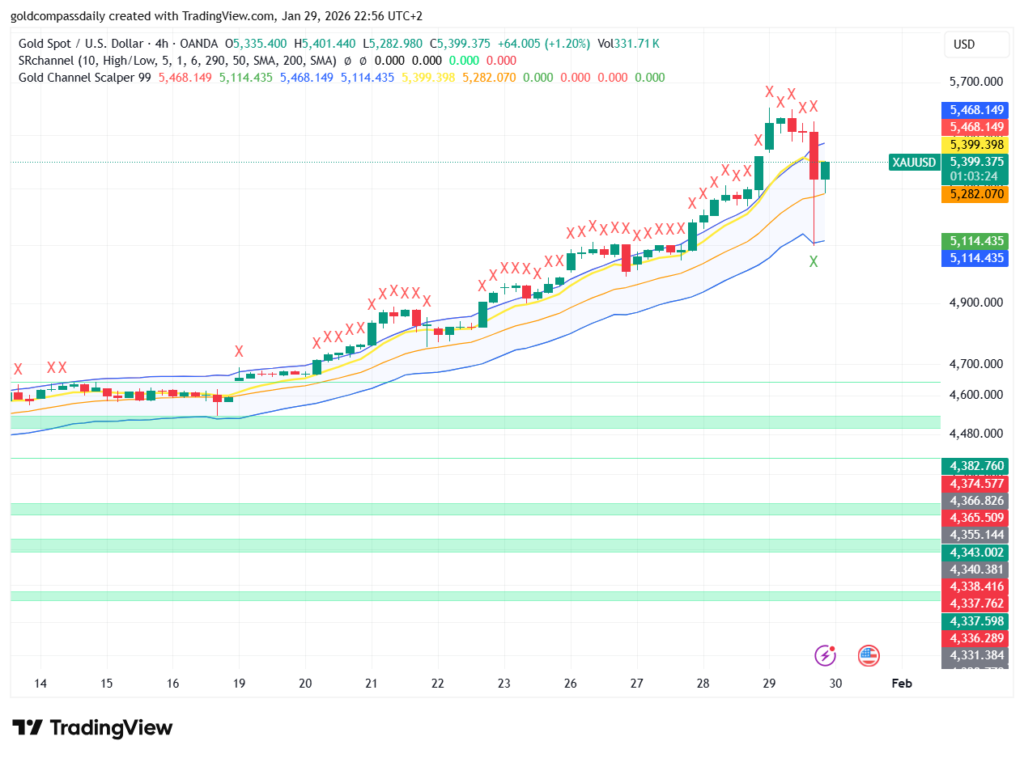
Everything started with a move that many analysts called “parabolic.” Gold prices soared past previous benchmarks, driven by central bank acquisitions and safe-haven demand. However, as we detailed in our deep dive into the Gold Price Correction, the market hit a wall near the $5,468 resistance zone. This pullback was necessary to wash out weak hands and overleveraged positions, preventing a bubble-like scenario that could have led to a more permanent collapse.
During this phase, the 4-hour chart showed clear signs of bearish divergence. While the headlines remained optimistic, the price action suggested that a temporary top was in place. This correction phase is a vital component of our broader Gold Price Analysis 2026, as it establishes the boundaries for the next major leg up.
Critical Foundations: Why $5,300 Matters
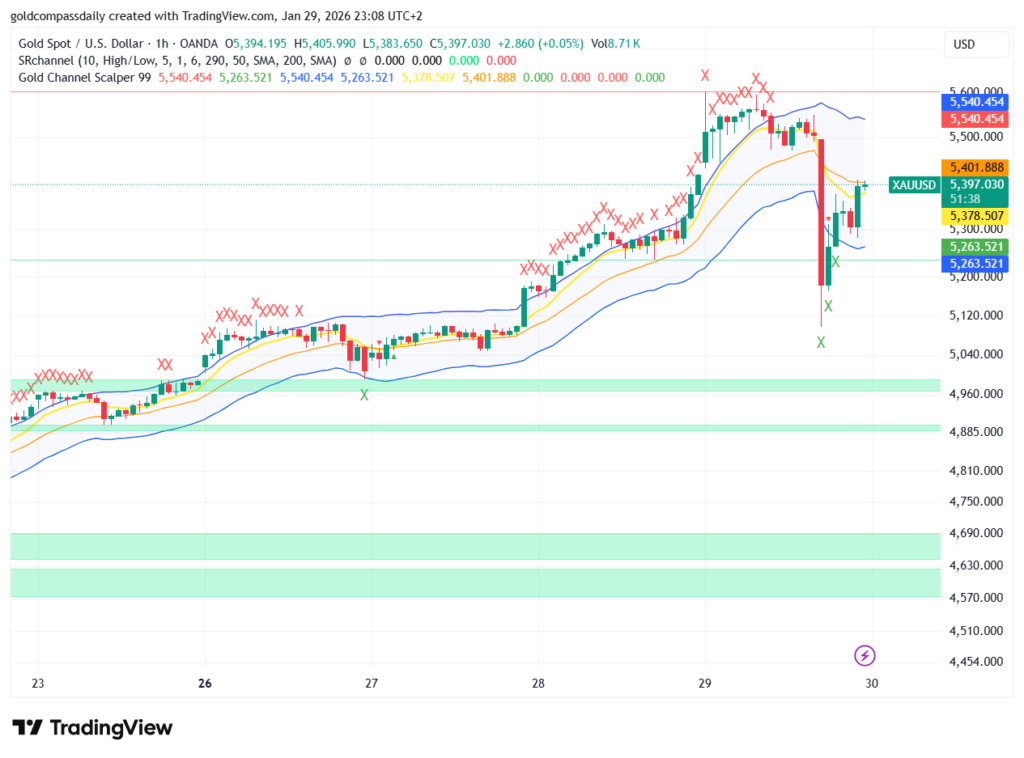
As the sell-off intensified, all eyes turned to the technical “floor.” Identifying the exact point where buyers would return was the primary focus of our mid-week report on Gold Price Support. The $5,300 level has emerged as a psychological and structural fortress for XAU/USD. Our analysis showed that this zone aligns with the 50-day EMA and a significant high-volume node, making it the “line in the sand” for the current bull market.
The ability of gold to hold above this support, despite the aggressive selling pressure, confirms that the underlying demand remains structural rather than speculative. In the context of our Gold Price Analysis 2026, the $5,300 zone is now the primary benchmark for risk management. A daily close below this level would necessitate a complete re-evaluation of our bullish targets for the second quarter.
The Road to Recovery: A V-Shape Signal
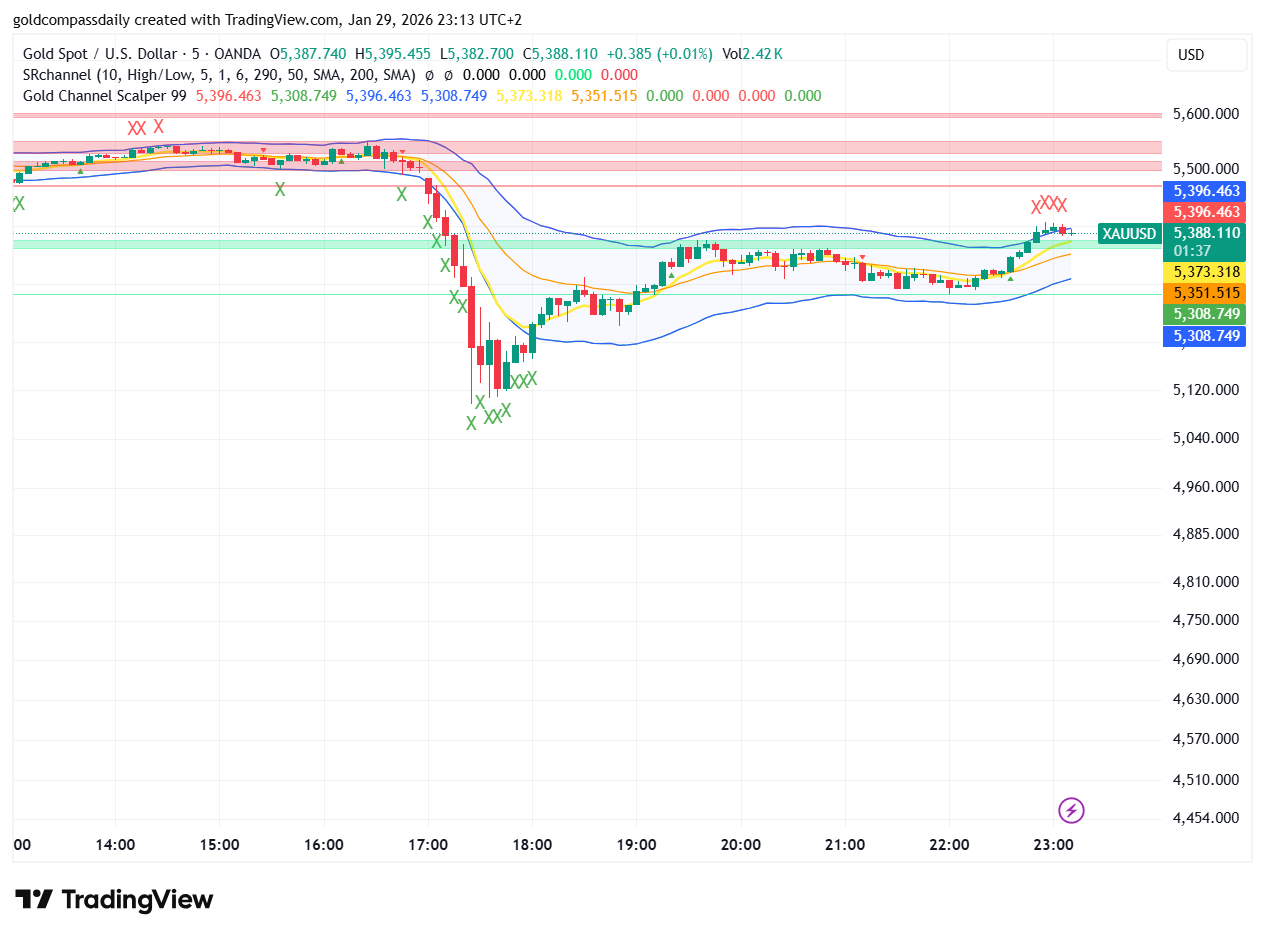
Perhaps the most exciting development in the last 48 hours has been the rapid turnaround on the lower timeframes. As discussed in our analysis of the Gold Price Recovery, the 5-minute and 15-minute charts produced a classic V-shape bounce. This type of price action often indicates a “liquidity grab,” where big players hunt for stops before pushing the price back in the direction of the primary trend.
This recovery hasn’t just been about price; it’s about momentum. The speed at which gold reclaimed the $5,350 and $5,380 levels suggests that the market is eager to put the correction behind it. For the Gold Price Analysis 2026 to remain fully bullish, we now need to see a consolidation above $5,400, which would open the doors for a retest of the $5,500 territory.
Strategic Outlook for 2026
Looking ahead, the macroeconomic environment continues to favor gold. With inflation expectations remaining volatile and global debt levels reaching new peaks, the “inflation hedge” narrative is stronger than ever. Our ongoing Gold Price Analysis 2026 suggests that while the journey will be marked by high-volatility events like the ones we’ve seen this week, the long-term trajectory points toward $6,000.
Traders should remain disciplined, using the support and resistance levels identified in our recent series of reports. The transition from a sharp correction to a steady recovery is often the most profitable phase for those who can remain calm amidst the noise of the 1-hour and 5-minute charts.
Conclusion
In summary, the gold market is currently in a healthy consolidation phase after a period of extreme growth. By understanding the interplay between the recent correction, the strength of the $5,300 support, and the emerging recovery signals, investors can navigate the 2026 market with confidence. Stay tuned to Gold Compass Daily as we continue to provide the most granular Gold Price Analysis 2026 available to the retail trading community.