
The global markets are currently experiencing a massive surge in Gold Price Volatility as XAU/USD faced a brutal rejection at the $5,479 resistance level. After a period of steady climbing, the 4-hour chart now shows a decisive bearish reversal that has caught many retail traders off guard. This sudden shift in momentum suggests that the local top may be in, as sellers have reclaimed control with high-volume candles.
Technical Breakdown: The Bearish Turn
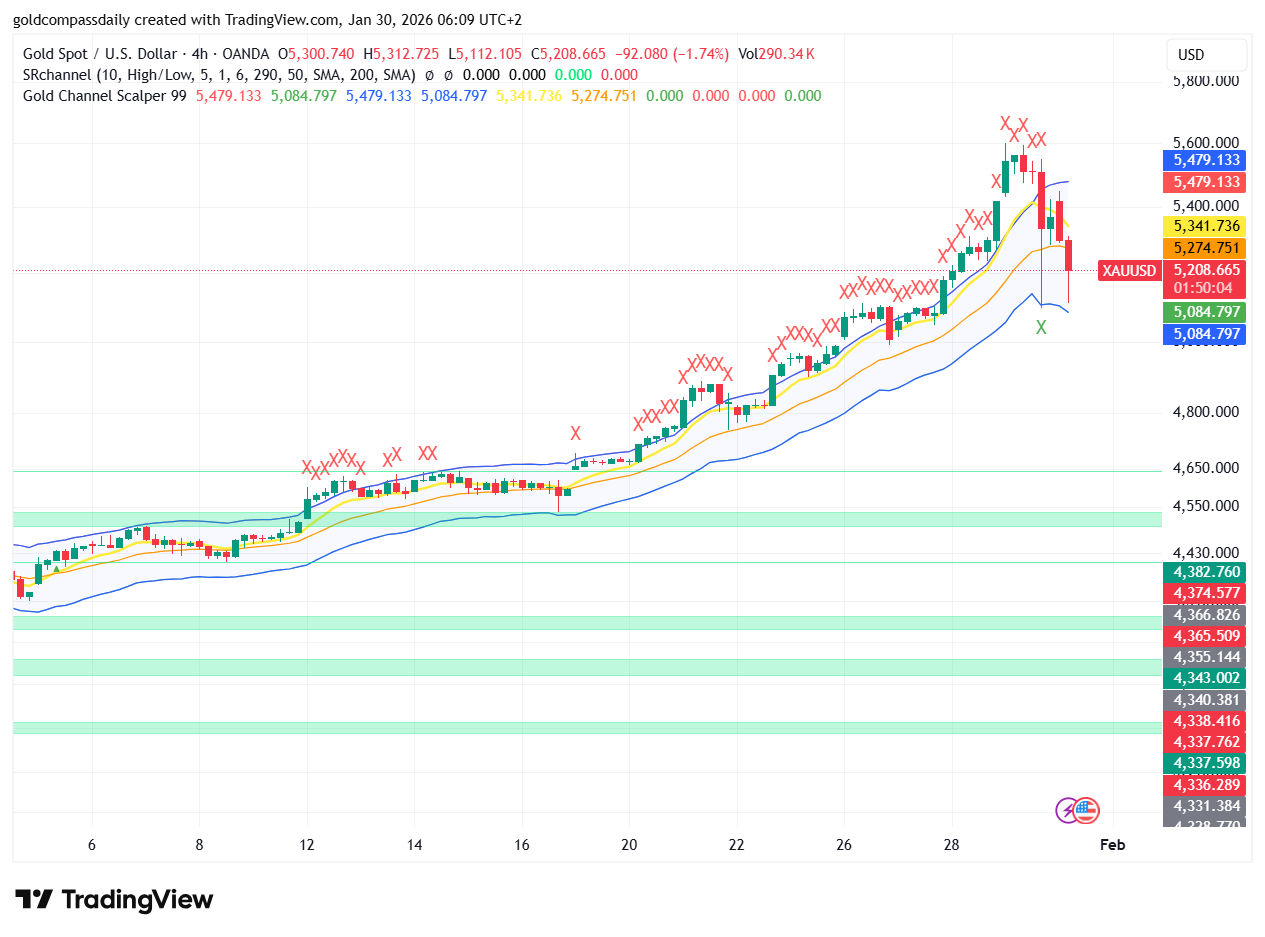
Looking at the latest data from the 4-hour timeframe, gold price action has produced a classic bearish engulfing pattern. The previous support at $5,341, which acted as a springboard for several days, was bypassed in a matter of hours. This increase in Gold Price Volatility has pushed the asset toward the lower boundary of the current volatility channel, specifically testing the $5,208 mark.
The Gold Channel Scalper 99 indicator, which we use to track intraday trends, has shifted its bands significantly. We are now seeing the price trading below the 50-period SMA (Simple Moving Average), a move that historically precedes deeper corrections. The “X” marks on the TradingView chart, provided by the SRChannel indicator, highlight multiple exhaustion points where the bullish momentum simply evaporated.
Key Support Zones to Watch
In times of extreme Gold Price Volatility, identifying historical floors is the only way to manage risk effectively. Based on the current structural setup, here are the primary zones for XAU/USD:
- Immediate Support ($5,114): This is the next major psychological and technical level. If the price fails to hold here, we could see a slide toward $5,000.
- Major Resistance ($5,479): The recent peak that initiated the sell-off. Any recovery attempt will face significant selling pressure here.
- Consolidation Zone ($5,274 – $5,341): This area now acts as a “supply zone” where bears are likely to reload their positions.
Fundamental Drivers in 2026
While the technicals show a clear bearish bias, the fundamental backdrop for Gold Price Volatility remains complex. Market participants are reacting to a combination of strengthening dollar indices and a shift in central bank rhetoric. In 2026, the cost of holding non-yielding assets like gold has become a focal point for institutional investors, leading to the rapid profit-taking we are witnessing on the charts today.
Geopolitical tensions continue to provide a baseline for safe-haven demand, but as the 4-hour chart indicates, technical exhaustion often overrides fundamental news in the short term. Traders should remain cautious, as the current volatility is likely to persist until the market finds a stable equilibrium near the long-term moving averages.
Trading Strategy: Navigating the Drop
For those looking to capitalize on the Gold Price Volatility, the current “sell the rallies” approach seems most prudent. A retest of the $5,300 level that fails to close above it would provide a high-probability entry for short positions targeting the $5,114 support. Conversely, aggressive buyers might look for a “double bottom” signal on shorter timeframes, but only if the $5,200 level holds on a daily closing basis.
The ‘X’ marks at the bottom of the previous moves (around Jan 27) show that gold has a habit of finding quick buyers. However, the current candle is much more aggressive than previous ones, suggesting that the “dip buyers” are currently sidelined. Patience is key during these high-velocity moves.
Conclusion
The current state of Gold Price Volatility is a reminder that the markets do not move in straight lines. After the incredible run toward $5,500, a significant retracement was inevitable. Whether this is just a healthy correction or the start of a broader bearish trend will depend on how the price reacts to the $5,114 support zone in the coming sessions. Stay disciplined and keep a close eye on the volume profiles as we head into the weekend.