
The recent sessions have provided a masterclass in market dynamics, showcasing the sheer intensity of XAU/USD Price Action. Within a remarkably short timeframe, gold has transitioned from a state of extreme bearish pressure to a delicate phase of stabilization and recovery. For traders and investors, understanding this sequence of events is crucial for navigating the complex environment of the 2026 financial markets, where volatility has become the new norm.
Phase 1: The Surge in Volatility and the $5,100 Threat
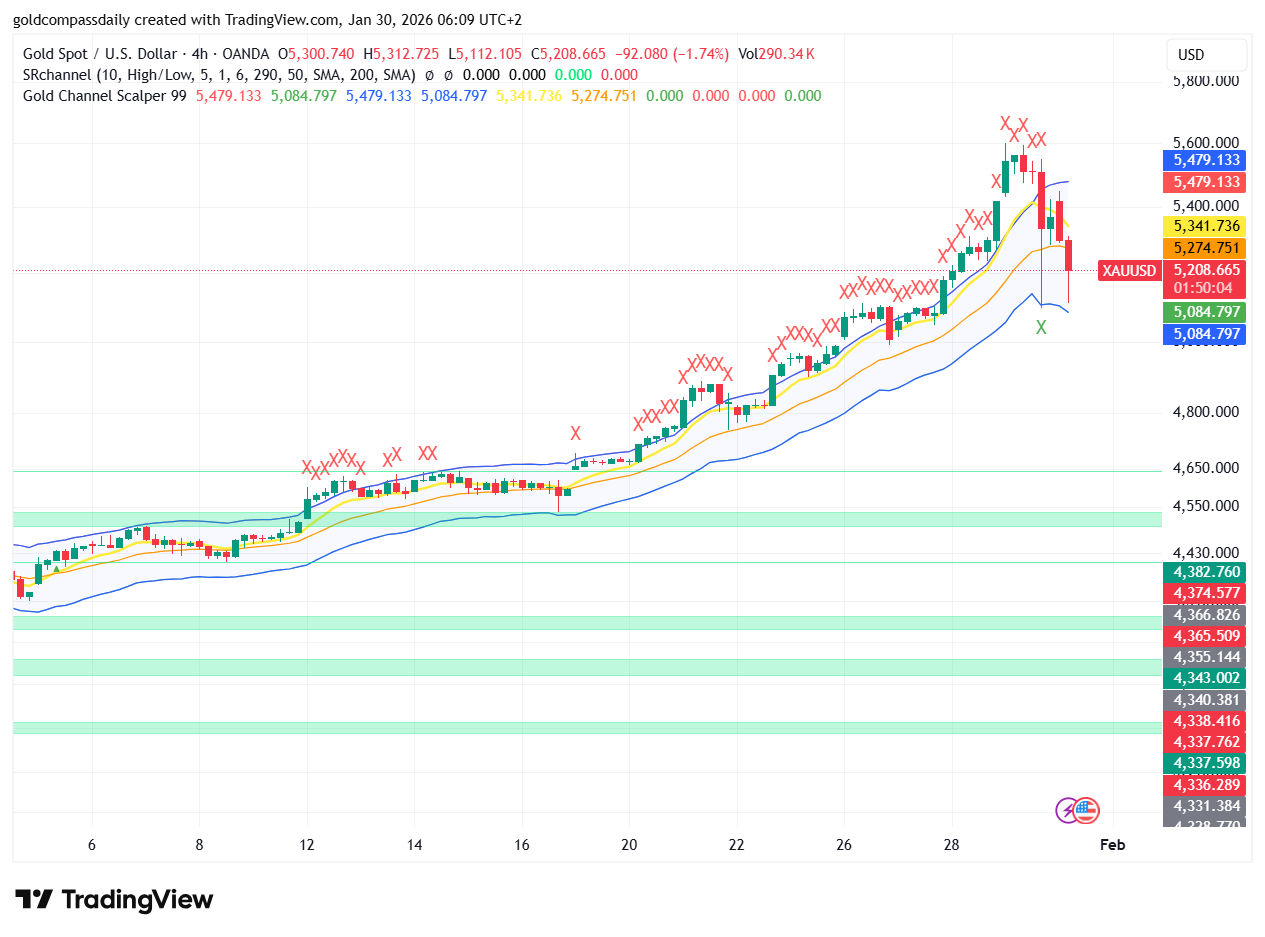
The journey began with an unexpected and aggressive sell-off that redefined the short-term landscape. As we explored in our analysis of Gold Price Volatility, the market faced a brutal rejection at the higher resistance zones. This move wasn’t just a simple pullback; it was a high-velocity drop that shattered several key moving averages, turning the spotlight toward the $5,100 psychological level.
During this phase, the XAU/USD Price Action was dominated by panic selling and institutional liquidation. The 4-hour chart showed a series of bearish engulfing candles, signaling that the momentum had shifted decisively in favor of the bears. This period of heightened volatility served as a reminder that gold, while a safe haven, is not immune to sharp technical corrections when overextended.
Phase 2: The Battle for the $5,300 Level
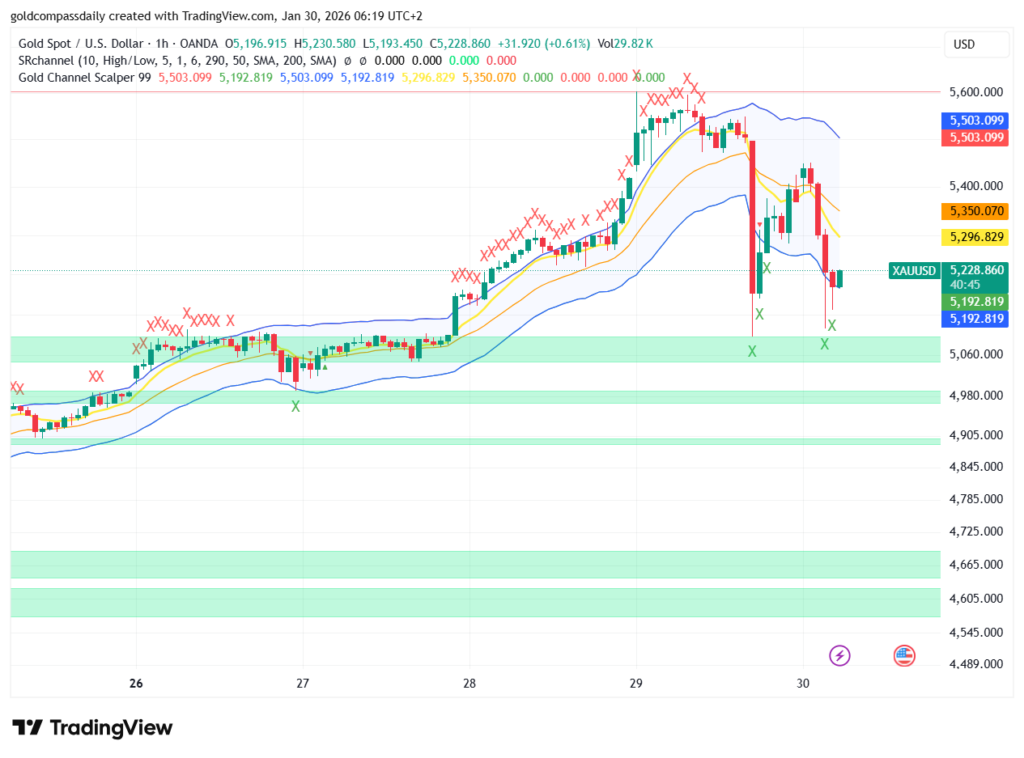
As the initial dust began to settle, the market entered a critical phase of structural testing. The focus shifted from the “crash” to the “foundation.” In our detailed Gold Price Outlook, we monitored the fierce struggle to reclaim and hold the $5,300 handle. This level represents more than just a number; it is a historical pivot point where buyers and sellers have locked horns multiple times in early 2026.
The 1-hour XAU/USD Price Action during this period was characterized by “wicks” and failed breakouts, indicating a high degree of indecision. While the bearish pressure remained significant, the emergence of hidden bullish divergences on the RSI suggested that the selling force was starting to wane. The battle for $5,300 became the defining moment for intraday sentiment, acting as the gateway for any potential bullish resumption.
Phase 3: Scalping the V-Shape Recovery
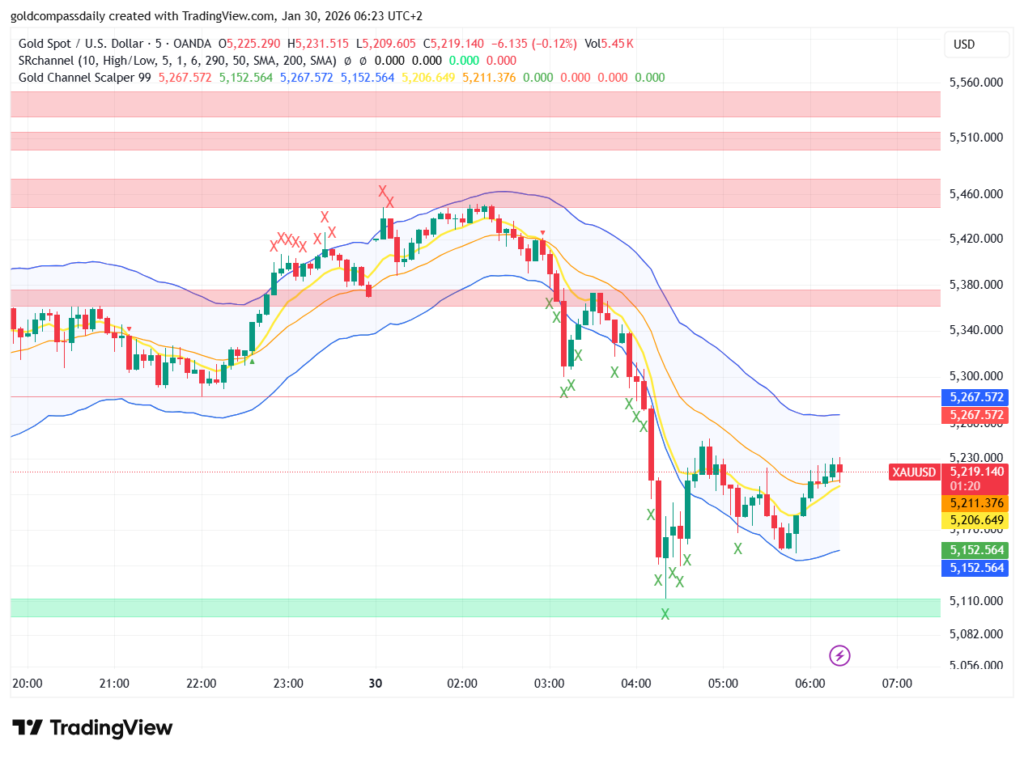
The most recent development in this saga has been the tactical shift seen on the lower timeframes. As the market stabilized near key support, agile traders began to spot opportunities for quick gains. Our look at Gold Price Recovery on the 5-minute chart highlighted a classic V-shape bounce—a sign that liquidity was being aggressively absorbed by “smart money.”
This micro-level XAU/USD Price Action provided the first concrete evidence that a bottom was potentially in place. By reclaiming the intraday EMAs and producing higher lows, gold signaled to the market that the worst of the volatility might be over. Scalpers took advantage of these signals, targeting the $5,350 and $5,380 zones, which have now transitioned from resistance back to supportive structures.
Integrating the Multi-Timeframe Perspective
To truly master XAU/USD Price Action, one must look at the market as a cohesive whole rather than isolated events. The 4-hour chart told us about the trend reversal, the 1-hour chart showed us the structural battle, and the 5-minute chart gave us the execution signals. This holistic approach is what separates successful traders from the rest.
Currently, the market sits at a crossroads. While the immediate recovery is encouraging, the scars of the recent volatility remain visible on the higher timeframes. For the XAU/USD Price Action to turn fully bullish again, we need a sustained consolidation above the $5,400 mark. Until then, the market remains in a “wait-and-see” mode, balancing the optimism of the recovery with the caution inherited from the recent drop.
Final Thoughts for 2026 Traders
As we head into the next trading cycle, the lessons from this week’s XAU/USD Price Action are clear: always respect the volatility and never ignore the key technical levels. Gold remains a highly reactive asset, influenced by a complex web of macroeconomic data and technical sentiment. By following the roadmap from the initial drop to the current recovery, traders can better position themselves for the next major move in the gold market.
Conclusion
In conclusion, the XAU/USD Price Action of the past few sessions has been a rollercoaster of technical signals. From the alarming volatility that targeted $5,100 to the disciplined recovery on the 5-minute charts, gold continues to provide ample opportunities for those who can read the charts correctly. Stay tuned to Gold Compass Daily for more real-time updates as we continue to track the world’s most precious metal through the challenges of 2026.