
Gold Price Reversal: The Great Liquidity Flush of 2026
The gold market has just sent a shockwave through the trading community. After weeks of climbing toward historic highs, we are witnessing a classic “liquidity flush” that has pushed prices back toward the critical $4,850 zone. For the general public, this move looks like a sudden collapse, but for the institutional players, it may be the ultimate Gold Price Reversal setup designed to trap early sellers.
When gold “dumps” like this, it’s rarely about the metal itself and almost always about the “Big Money” positioning themselves before major economic shifts. With the Bank of England and the US Jobless data looming, the current price action is a textbook example of market manipulation meeting technical necessity.
4-Hour Chart Breakdown: Bulls vs. Bears at the Edge
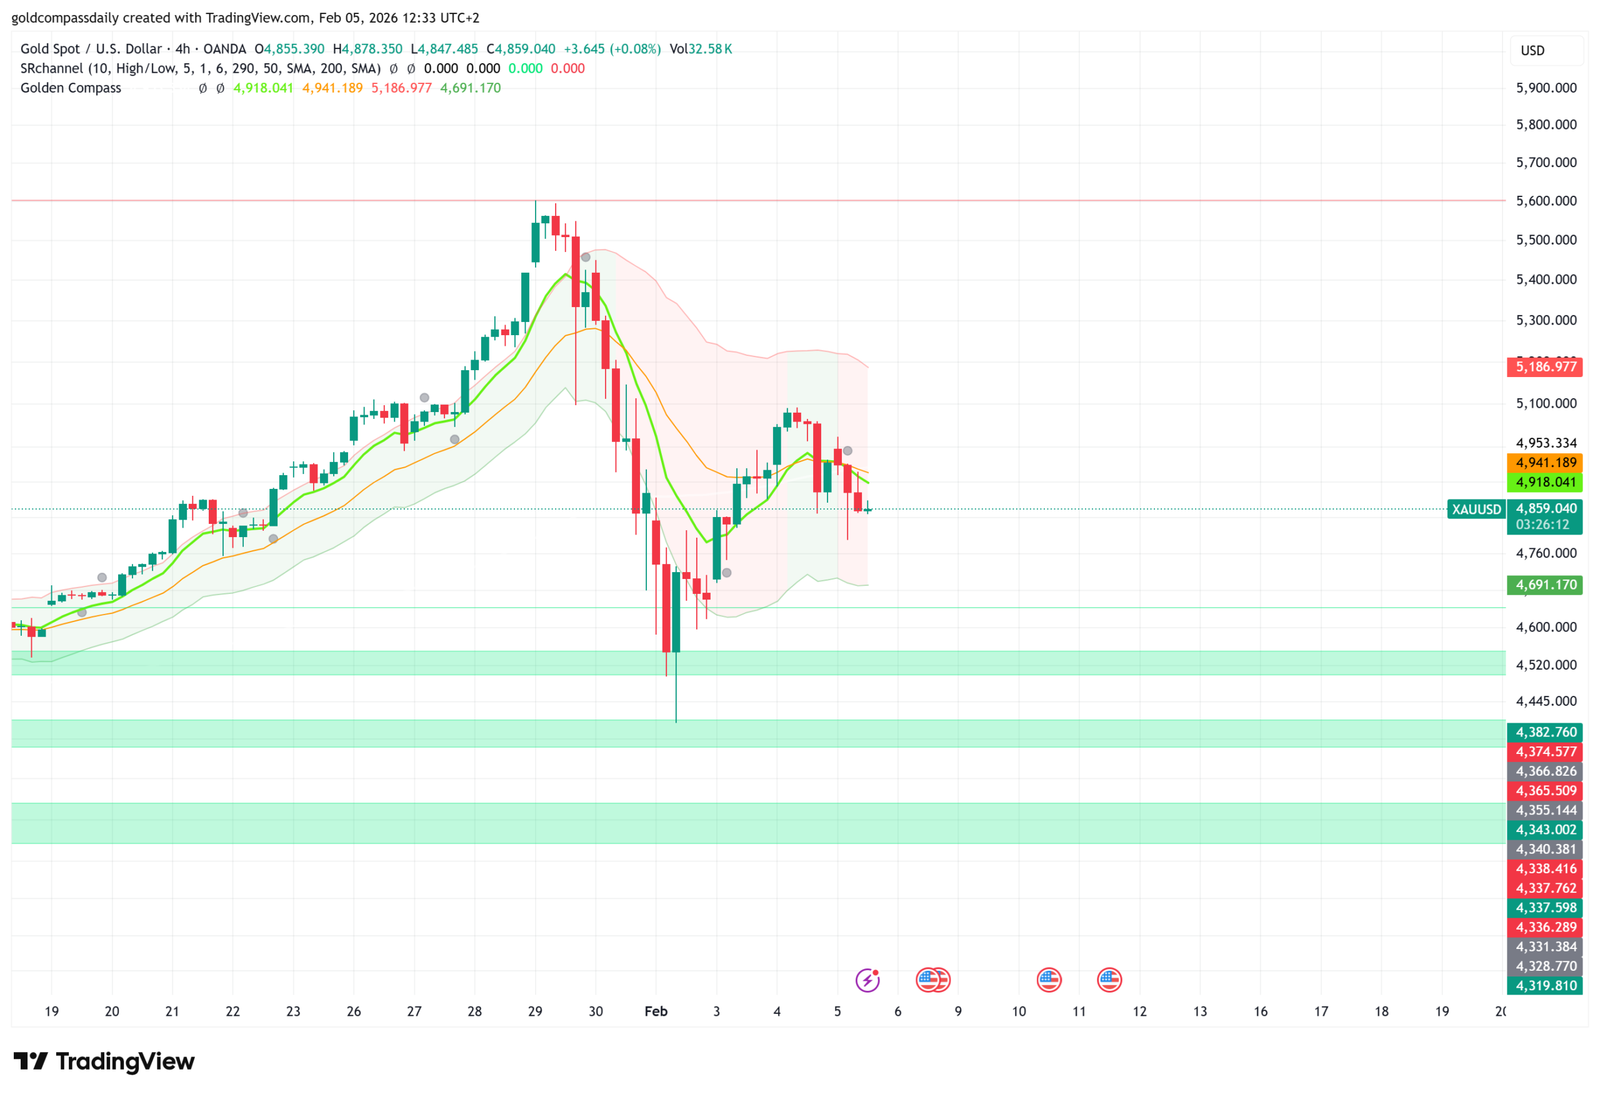
Looking at the 4-hour (4H) timeframe, the technical picture is intense. Our “Golden Compass” indicator shows that gold has officially breached the short-term support levels, diving deep into the green “Value Zone.” This is where the most aggressive Gold Price Reversal patterns typically begin.
- The Support Floor ($4,830 – $4,860): Gold is currently “bouncing” off a major historical support. If the 4H candle closes above $4,860, the reversal case becomes significantly stronger.
- The Resistance Ceiling ($4,941): This is the first hurdle. To confirm that the crash is over, buyers need to reclaim this level with high volume.
- Liquidity Hunt: The long “wicks” on the bottom of the recent candles suggest that big buyers are stepping in to absorb the sell orders of panicked retail investors.
Why This “Crash” Might Be a Giant Trap
In the world of finance, a “Fakeout” is a move intended to deceive the majority of market participants. The current Gold Price Reversal signals suggest that the market may be shaking out “weak hands” before a massive rally. For the general audience, it’s important to understand that gold often drops right before a major news event to create a “cheaper” entry for banks.
If you own gold or are considering buying, these $100+ price swings are the moments where fortunes are made or lost. The 4-hour chart is currently in an “Oversold” state, meaning the selling pressure has likely reached its peak. Historically, when gold hits these specific green zones on our proprietary indicators, a sharp move in the opposite direction is often just hours away.
The “Super Thursday” Connection
We cannot ignore the elephant in the room: The Economic Calendar. With the Bank of England rate decision and US Unemployment claims hitting the wires today, the Gold Price Reversal we are analyzing is perfectly timed. High volatility in the labor market usually weakens the US Dollar, which acts as rocket fuel for gold prices.
Levels to Watch for the Remainder of the Day:
1. **The Trap Zone:** Watch for a fake break below $4,830 followed by a quick recovery. This is a classic “Stop Run.”
2. **The Confirmation:** A sustained hold above $4,918 will signal that the bears have lost control and the path to $5,100 is reopened.
Conclusion: Strategic Patience
The Gold Price Today is not for the faint of heart. We are at a crossroads where technical analysis meets raw human emotion. Whether this is a true Gold Price Reversal or a deeper dive into a bear market depends entirely on the next few 4-hour candles. Our advice? Don’t chase the move—wait for the market to prove its next direction at the support levels we’ve identified.