
On February 9, 2026, gold prices are staging a notable comeback, with XAU/USD trading around $5063 per ounce, up 0.33% intraday. This follows a volatile start to the month, where prices dipped to lows near $4700 before rebounding strongly. Spot gold is currently at approximately $5057, according to sources like Trading Economics and Investing.com, reflecting gains of 1.8% today amid softer U.S. dollar and bond yields. For casual investors eyeing gold as an inflation hedge, and traders hunting volatility plays, this gold price forecast examines the 4-hour chart dynamics, key drivers, and potential scenarios ahead. With forecasts from JPMorgan pointing to $6000+ by year-end, is this the start of another leg up?
Current Market Snapshot: Gold Price Forecast Overview
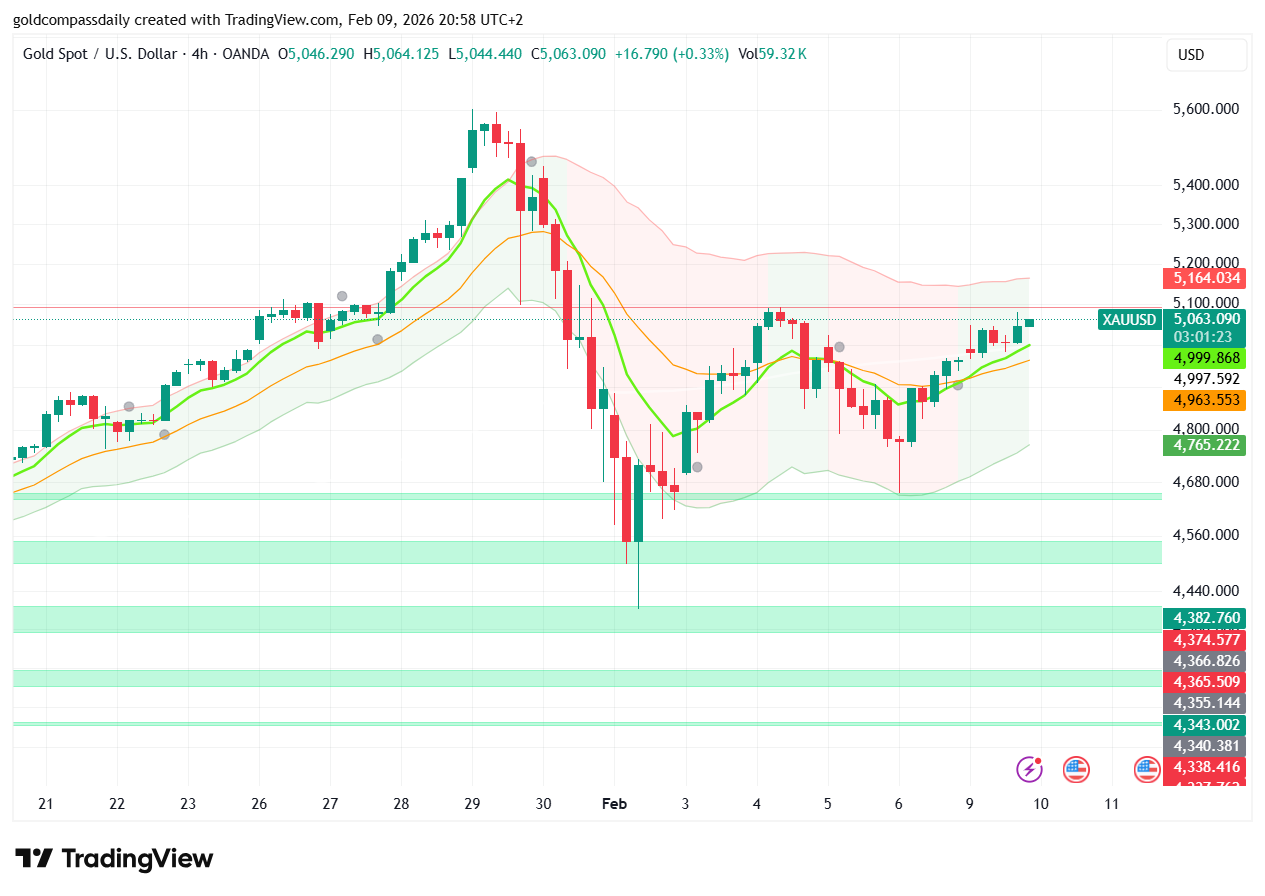
The yellow metal has recovered over 6% in recent sessions, holding firmly above $5000 after testing lower supports. As per real-time data from Kitco and FOREX.com, gold spot prices rose to $5057–$5064 today, with a session high of $5064.125 and low of $5044.440. Volume at 59.32K suggests increasing interest, especially as the DXY weakens. Over the past month, gold has climbed nearly 10%, up 73% year-over-year, driven by record central bank purchases and geopolitical uncertainties.
For the average person, gold’s appeal lies in its role as a “safe store of value” – when economies wobble, prices tend to rise. With U.S. data like jobs reports looming, this forecast highlights opportunities for both short-term trades and long-term holdings, making it accessible beyond just Wall Street pros.
Technical Breakdown: The 4-Hour Chart Analysis
The 4-hour TradingView chart for XAU/USD reveals a classic rebound pattern after a sharp correction. Covering late January to February 9, prices climbed steadily from $4800–$4900 around January 22–26, peaking near $5100 by January 30. A bearish pullback followed, with red candles dominating February 3–5, dropping to $4650–$4700 lows – a 16–18% correction from January’s all-time high of $5608.
Since then, bullish green candles have taken over, forming an uptrend channel supported by the SR Channel indicator. The latest bars show consolidation above $5000, with a minor dip to $5044 before recovering to $5063. Key levels include:
- Resistance ($5064–$5100): This overhead zone has capped recent highs; a decisive break could propel prices toward $5128–$5200, aligning with the Golden Compass upper band at $5164.034.
- Support ($5044–$4965): The session low here acts as immediate defense. Holding this prevents retesting February lows, while a breach might signal a deeper pullback to $4900.
- Moving Averages: The 50-period SMA at ~$5031 trends upward, crossing above the 200-period at $4997 – a bullish “golden cross” signal. Momentum indicators imply overbought risks, but the structure favors buyers.
This V-shaped recovery suggests the market flushed out speculators during the dip, setting up for potential new highs. Even for non-traders, visualizing this as a “bouncing ball” helps – gold hits a floor and springs back when demand kicks in.
Fundamental Drivers Shaping the Gold Price Forecast
Fundamentals underpin the rebound: Kevin Warsh’s Fed Chair nomination introduces hawkish vibes, but markets are pricing in softer data, weakening the dollar and yields. USAGold reports spot gold at $5034 earlier today, up 1.7%, fueled by China’s 15-month buying streak and Middle East tensions providing a “geopolitical floor.”
Upcoming U.S. January jobs and CPI data this week could dictate direction – weak numbers might boost gold to $5100+, while strong reads cap it via dollar strength. Broader outlook remains bullish: Trading Economics predicts $5347 in 12 months, citing fiscal concerns and central bank hoarding (230 tonnes added in Q4 2025 per World Gold Council). For everyday folks, this means gold could protect against 2026 inflation spikes, especially with analysts like Deutsche Bank echoing $6000 targets.
Trading Strategy: Practical Tips for Traders and Investors
On the 4-hour timeframe, opportunities abound for swing trades. Bulls can enter longs above $5064 with stops below $5044, targeting $5100–$5128. Bears might short breakdowns under $4965, aiming for $4900, but with caution given the uptrend. Risk 1% per trade and scale in on confirmations to manage volatility.
For non-traders, consider ETFs like GLD on dips below $5000 for dollar-cost averaging. Market sentiment has shifted from fear (post-January correction) to greed, with the “healthy reset” allowing smart money accumulation. As FOREX.com notes, ongoing uncertainty supports buying pressure in XAU/USD.
Conclusion: Optimistic Gold Price Forecast with Risks
This gold price forecast points to continued upside if supports hold, with the 4-hour chart confirming a bullish bias amid favorable fundamentals. While data risks could trigger pullbacks, structural demand from central banks and safe-haven bids keep the 2026 outlook bright. Watch $5000–$5100 levels closely, and remember: gold thrives in uncertainty.
Whether trading pips or holding for the long haul, gold’s resilience offers value in turbulent times.