
As of February 11, 2026, gold prices are demonstrating renewed strength in early trading, with XAU/USD climbing to $5055.510 per ounce, down slightly 0.01% but showing a robust rebound from session lows. This follows a consolidation phase where prices tested supports near $5045 before pushing higher. Current spot prices range from $5045.165 low to $5060.660 high, according to real-time data from TradingView and Investing.com, with volume at 32K indicating building interest. For everyday investors seeking to protect against inflation, and for active traders capitalizing on volatility, this gold price today analysis explores the 1-hour chart dynamics, underlying factors, and potential future moves. With central bank demand and geopolitical tensions persisting, could this surge mark the beginning of a sustained rally?
Current Gold Price Today Overview
Gold has started the day on a positive note, recovering from overnight dips and holding above key psychological levels. By 06:35 UTC+2, XAU/USD has rebounded to $5055.510, closing the latest 1-hour candle with minimal change (-0.380). This represents a net gain of about 0.5–1% from recent lows, amid low-volume trading (32K) typical for early Asian sessions. Over the past week, gold has gained approximately 2.5%, and year-over-year it’s up over 75%, driven by record central bank purchases, as reported by Kitco and Trading Economics.
For non-traders, gold’s price movements reflect broader economic sentiment – rising when uncertainty grows. Today, with U.S. data like CPI looming, this stability could signal opportunities for diversifying savings through simple investments like ETFs or bars, without needing expert timing.
Technical Breakdown: The 1-Hour Chart Insights
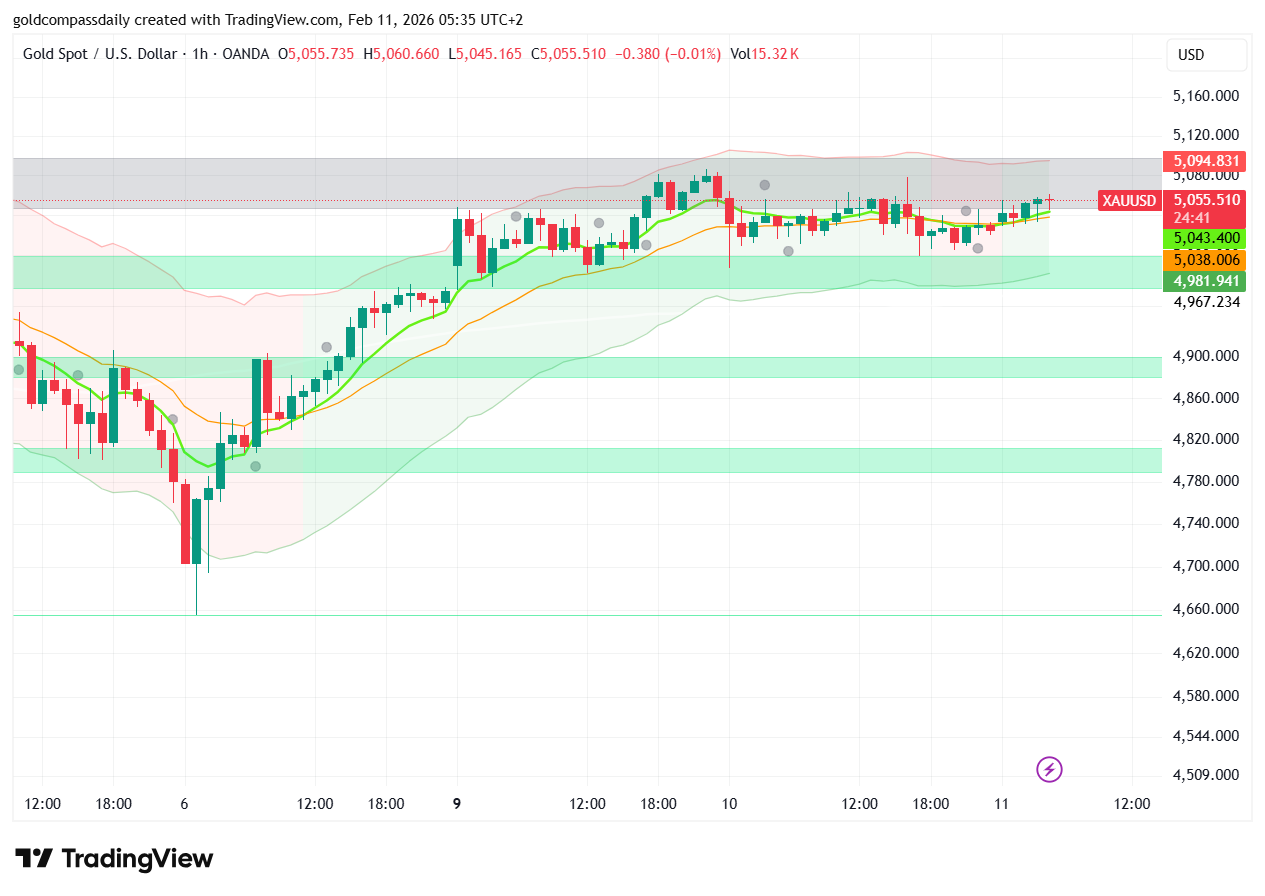
The 1-hour TradingView chart for XAU/USD illustrates a bullish rebound within a consolidation channel. Covering February 6–11, prices dipped to lows near $4980 on Feb 9–10, forming red candles that tested lower boundaries. The latest bars show strong green momentum: a series of upward candles pushing from $5045.165 low, crossing the 50-period SMA at ~$5050 and closing at $5055.510 with increasing conviction.
Key technical levels on the 1-hour timeframe include:
- Resistance ($5060–$5094): This zone has capped recent highs; a decisive break above $5060 could accelerate toward $5100–$5128, aligning with the Golden Compass upper band at $5094.831.
- Support ($5045–$5016): The session low at $5045 serves as immediate pivot. Holding here prevents retesting $5000, while a bounce reinforces bullish structure.
- Moving Averages & Indicators: The 50-period SMA at ~$5050 now acts as dynamic support, with shorter MAs trending upward. Momentum shows positive divergence, suggesting accumulating upside despite moderate volume (32K).
The chart’s “higher low” pattern indicates accumulation – a setup often seen in bull markets where dips attract buyers. For beginners, this means gold is shaking off weakness, potentially positioning for further gains if catalysts align.
Fundamental Drivers Shaping Gold Prices
Fundamentally, today’s surge is bolstered by a softer U.S. dollar and falling Treasury yields, countering hawkish Fed rhetoric. Kevin Warsh’s nomination as Fed Chair adds mixed signals, but markets anticipate dovish pivots if CPI data tomorrow underperforms. China’s extended gold-buying streak (15 months) provides a safety net, amid currency concerns, as noted in Reuters and World Gold Council reports.
Geopolitical supports (Middle East, U.S. tariffs) and fiscal worries further underpin prices. Analysts from JPMorgan forecast $6000+ by year-end, citing de-dollarization trends. For average readers, this highlights gold’s defensive role – a buffer against volatility, ideal for retirement accounts or emergency funds.
Trading Strategy: What to Watch Next
For traders on the 1-hour chart, the rebound offers tactical entries: buy pullbacks near $5045 support with stops below $5016, targeting $5060–$5094 for intraday profits. Swing traders should await a close above $5060 to enter longs toward $5128, using 1–2% risk in this building-volume setup (32K).
Non-traders can dollar-cost average on minor dips, leveraging the bull trend. Market psychology leans positive after flushing leverage – this recovery clears weak positions, setting up for potential new highs as in prior cycles.
Conclusion: Momentum Building for Upside
This gold price today analysis reveals a market gaining traction, with the 1-hour chart pointing to further advances if resistance breaks. While short-term risks from data persist, fundamentals like demand and uncertainty keep the 2026 outlook bullish. Monitor $5000–$5100 levels, and remain vigilant in volatile sessions.
Gold’s timeless appeal endures – whether for trading edges or long-term security, today’s insights empower informed choices.