
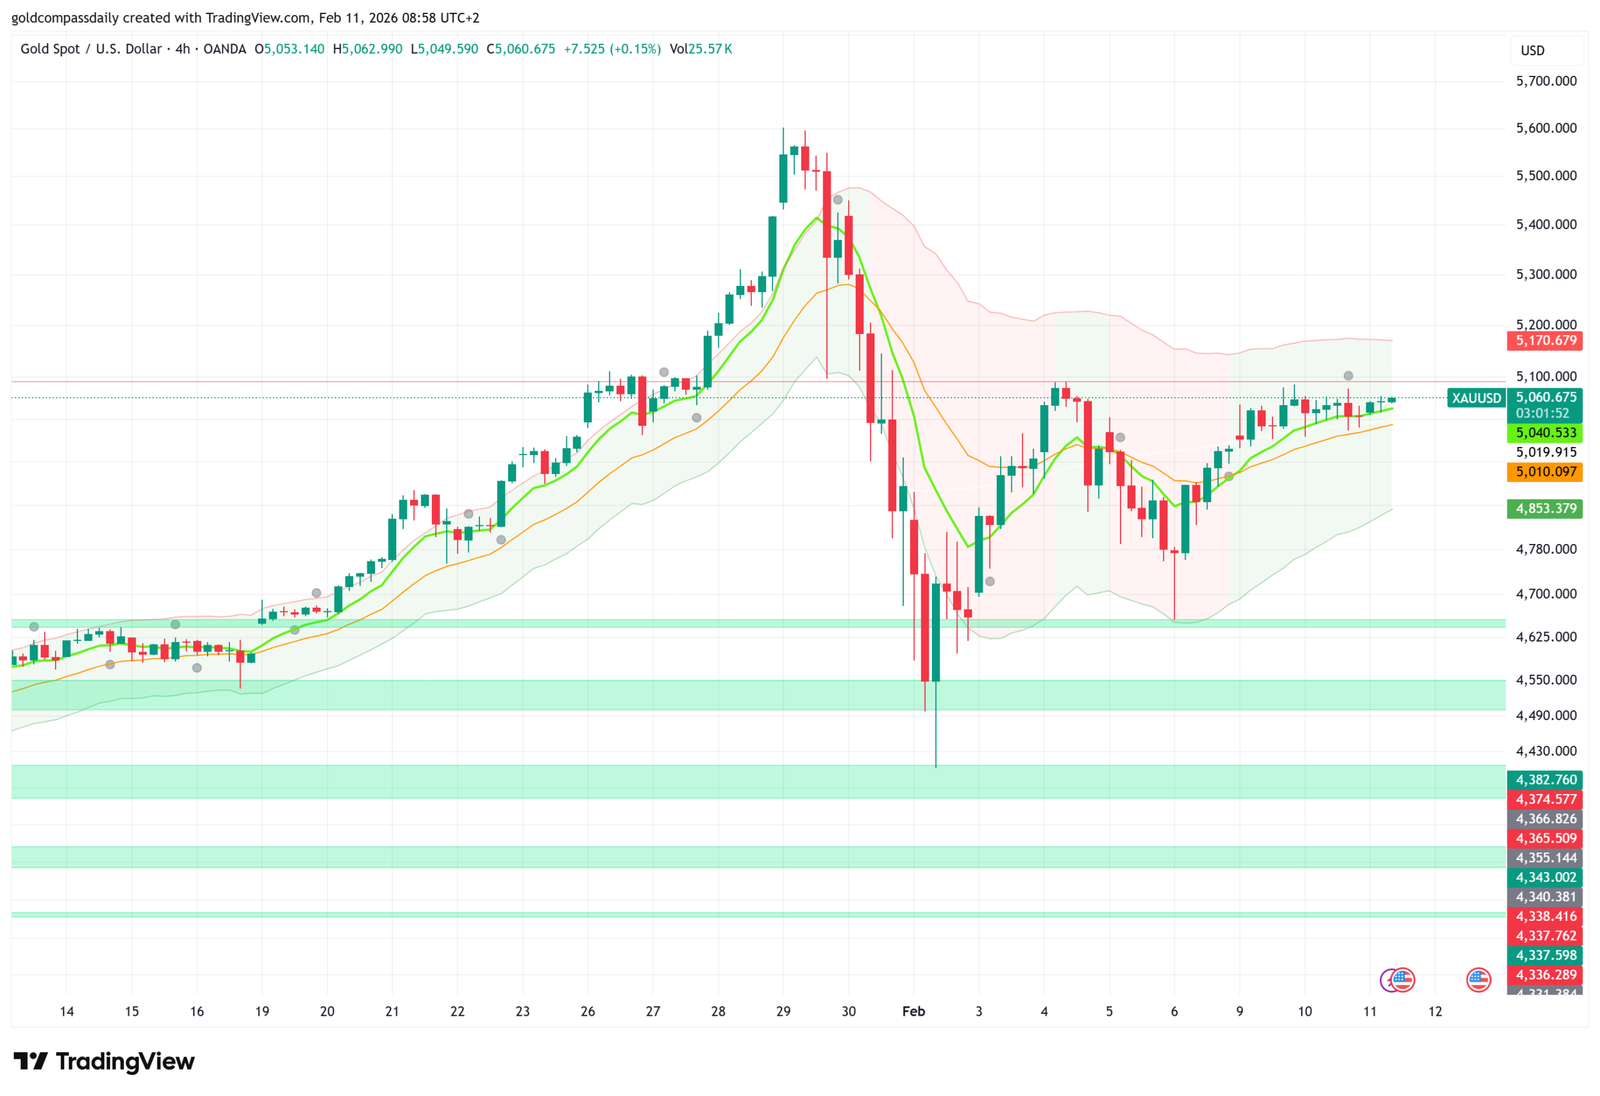
As of February 11, 2026, gold prices are showing signs of recovery, with XAU/USD trading around $5053.140 per ounce, up 0.15% from recent levels. This follows a multi-week consolidation where prices dipped to lows near $4700 before bouncing back. Current spot prices range from $5049.590 low to $5062.990 high, according to real-time data from TradingView and Investing.com, with volume at 25.7K indicating steady interest. For everyday investors considering gold as a hedge against uncertainty, and for active traders eyeing medium-term trends, this gold price today analysis examines the 4-hour chart dynamics, fundamental influences, and potential future paths. With central bank buying and U.S. data on the horizon, could this rebound evolve into a sustained rally?
Current Gold Price Today Overview
Gold has maintained a bullish bias over the past month, recovering from January lows around $4370 to current levels above $5000. By mid-morning UTC, XAU/USD has stabilized near $5053.140, reflecting a net gain of about 1.5% from yesterday’s close. This movement comes amid low-volume trading (25.7K), typical for transitional periods. Over the past year, gold has surged over 75%, driven by geopolitical tensions and inflation fears, as reported by Kitco and Trading Economics. Recent highs reached $5170 in late January, followed by a 10–15% correction to $4700 in early February, before the ongoing rebound.
For non-traders, gold’s price trajectory often mirrors global events – rising during crises or when currencies weaken. Today, with steady demand, this stability could signal a good entry for diversifying portfolios through simple options like ETFs or coins, without needing market timing expertise.
Technical Breakdown: The 4-Hour Chart Insights
The 4-hour TradingView chart for XAU/USD depicts a classic rebound from correction lows. Spanning January 14 to February 11, prices formed an uptrend channel with strong gains from $4376 on Jan 14 to peaks around $5170 by Jan 23. A bearish pullback ensued, with red candles dominating Feb 3–5, dropping to $4700 lows – a 15% retracement from highs. The latest bars show bullish reversal: green candles building from $4780 on Feb 6, crossing key moving averages and closing at $5053.140 with increasing momentum.
Key technical levels on the 4-hour timeframe include:
- Resistance ($5062–$5170): This overhead zone has capped recent advances; a decisive break above $5062 could target $5200–$5300, aligning with the Golden Compass upper band at $5170.679.
- Support ($5049–$4900): The session low at $5049 acts as immediate pivot. Holding here averts retesting February lows, while a bounce reinforces the uptrend.
- Moving Averages & Indicators: The 50-period SMA at ~$5000 provides long-term support, with shorter MAs trending upward in a bullish crossover. Momentum indicators show positive divergence, suggesting accumulating strength despite moderate volume (25.7K).
The chart’s “V-shaped” recovery pattern signals strong buying interest – a common feature in bull markets where dips are aggressively bought. For beginners, this means gold is shaking off sellers, potentially positioning for higher ground if catalysts align.
Fundamental Drivers Shaping Gold Prices
Fundamentally, today’s rebound is supported by a softer U.S. dollar and easing yields, offsetting hawkish Fed commentary. Kevin Warsh’s nomination as Fed Chair introduces uncertainty, but markets anticipate dovish shifts if CPI data underperforms tomorrow. China’s central bank extended its gold-buying streak to 15 months, adding structural demand amid currency risks, as per Reuters and World Gold Council reports.
Geopolitical factors (Middle East conflicts, U.S. tariffs) and fiscal concerns further bolster prices. Analysts from JPMorgan and Deutsche Bank forecast $6000+ by year-end, citing de-dollarization and inflation persistence. For average readers, this underscores gold’s defensive appeal – a reliable asset for protecting wealth during economic shifts, accessible via brokers or apps.
Trading Strategy: What to Watch Next
For traders on the 4-hour chart, the rebound offers swing opportunities: buy dips near $5049 support with stops below $4900, targeting $5062–$5170 for measured gains. Intraday scalpers can fade resistances for shorts if volume fades, using 1% risk per trade in this moderate-volume setup (25.7K).
Non-traders can dollar-cost average on pullbacks below $5050, capitalizing on the bull trend. Market psychology favors buyers after leverage flushes – this recovery clears weak positions, setting the stage for potential new highs in upcoming cycles.
Conclusion: Rebound Momentum Growing
This gold price today analysis highlights a market regaining footing, with the 4-hour chart suggesting continued upside if resistances yield. While short-term data risks remain, fundamentals like demand keep the 2026 outlook positive. Monitor $5000–$5100 levels, and adapt to volatile conditions.
Gold’s role as a timeless protector endures – whether for trading or security, today’s insights empower informed decisions.