
Gold has broken out. After weeks of navigating post-FOMC hawkishness, Liberation Day tariff shocks, and Easter holiday thin liquidity, XAU/USD surged from $4,615 to a session high of $4,860 overnight — a $245 move driven by reports of a ceasefire agreement with Iran that temporarily reduced Middle East risk premium before markets reassessed the broader geopolitical implications. Price is now consolidating at $4,797, holding well above the green demand zones that defined last week’s range. The 15-minute chart projects a minor dip to $4,779.299 before a continuation toward $4,900+. The session’s defining event arrives tonight: the FOMC Meeting Minutes at 9:00pm — the most detailed account of the Fed’s thinking since the hawkish March decision that triggered gold’s post-$5,200 collapse.
The Chart: Breakout Confirmed, Consolidation Is Healthy
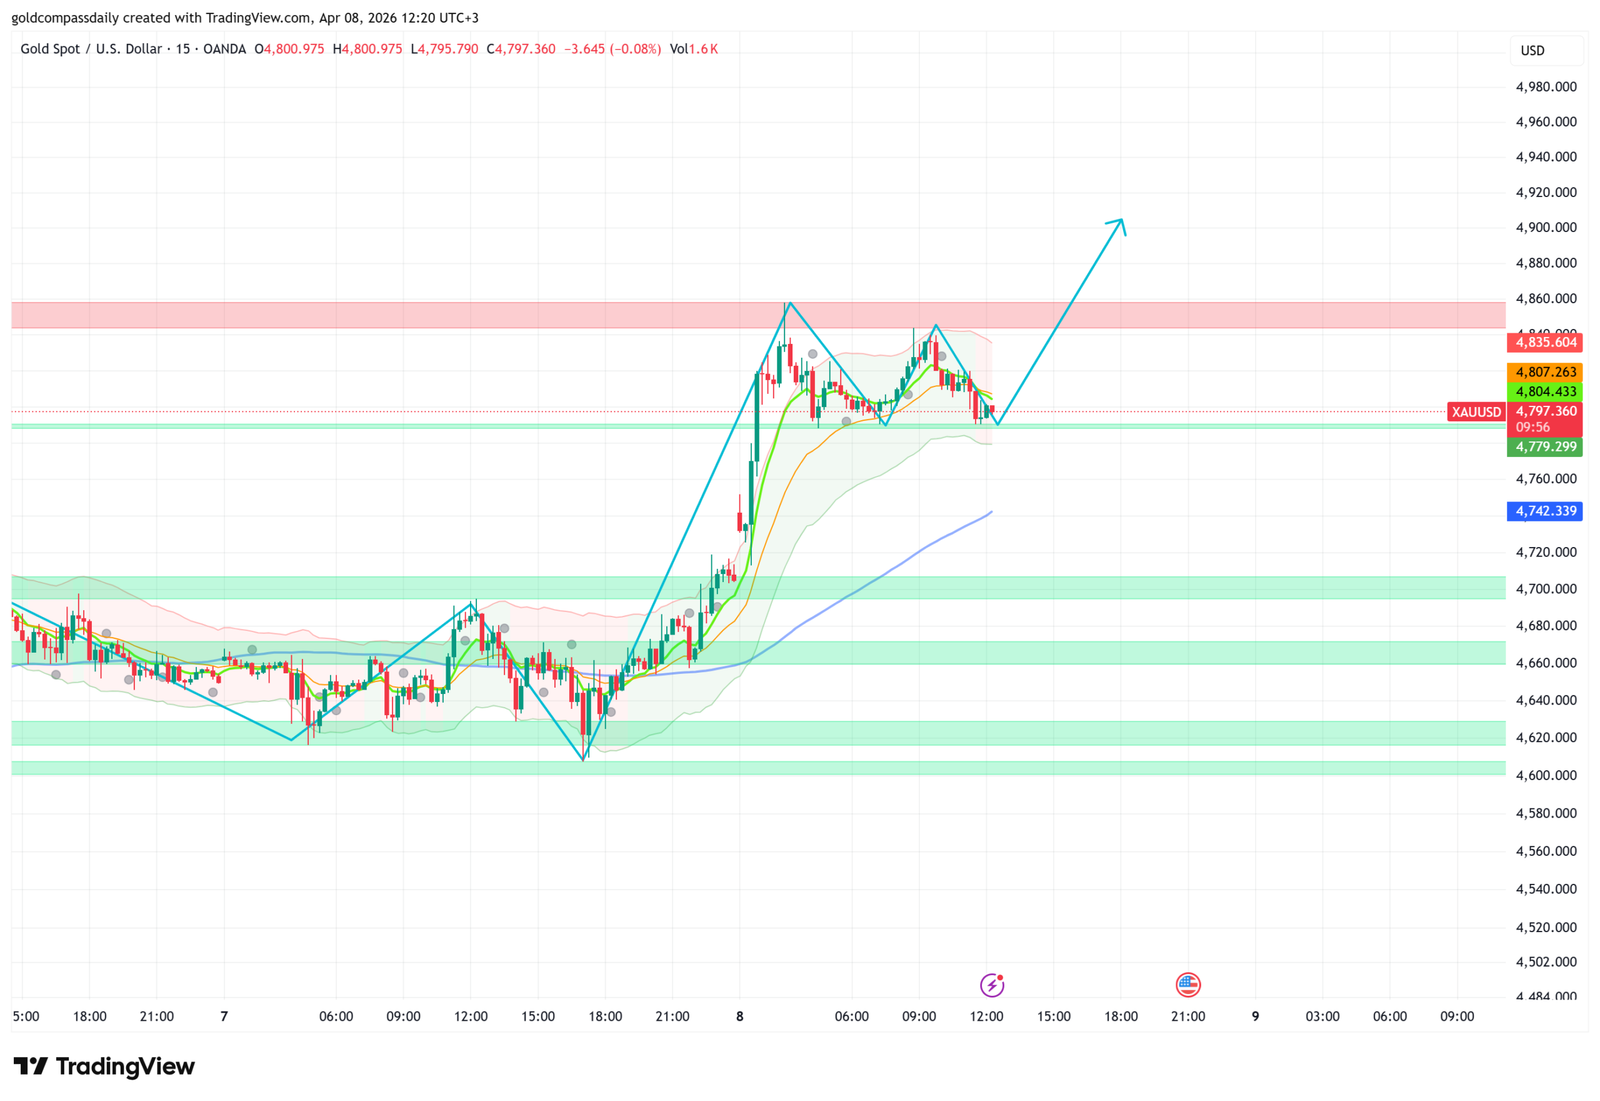
The structure of the 15-minute chart has shifted decisively. The green demand zones at $4,620–$4,660 that defined the post-Liberation Day consolidation have been left well below current price. The move from $4,615 to $4,860 was sharp, vertical, and sustained — the hallmark of a genuine breakout rather than a short squeeze that immediately reverses.
Price is now consolidating in a narrow band between $4,779.299 and $4,835.604. The moving averages on the 15-minute chart are pointing sharply higher, the Bollinger Bands have expanded upward, and each pullback from the $4,860 high has held progressively higher. The projected path on the chart shows a dip to $4,779 — which now acts as support rather than resistance — before the continuation toward $4,900+.
The pink resistance band between $4,835.604 and approximately $4,860 is the immediate ceiling. A clean close above $4,860 would represent a new multi-week high and open the path toward $4,900 and the $4,950–$5,000 zone beyond. The floor to hold is $4,742.339 — the lower green support level. A close below that would suggest the geopolitical-driven spike is fading and the range-bound $4,650–$4,750 environment could reassert itself.
The Iran Catalyst: Geopolitics Meets Gold
The overnight surge was triggered by news of a ceasefire agreement involving Iran — reducing the immediate risk of regional escalation that had been a secondary support factor for gold throughout March. The initial market reaction was a sharp gold rally as the safe-haven premium expanded — but the subsequent consolidation near $4,797 rather than a full reversal back to $4,615 is the telling signal. Gold is not giving back the gains. That behaviour suggests the move is not purely geopolitical but is reinforced by the broader macro backdrop: tariff inflation, Fed uncertainty, and the structural safe-haven demand that has been building since Liberation Day.
Middle East geopolitics remain fluid. Any reversal of the ceasefire narrative — renewed hostilities, escalation, or expansion of the conflict — would be a secondary catalyst for another gold spike. Conversely, a sustained and verified de-escalation removes one layer of the safe-haven premium but leaves the tariff, inflation, and Fed uncertainty factors fully intact.
Already Published: Japan Beats, Europe Mixed
Japan’s Average Cash Earnings y/y printed at 3.3% — significantly above the forecast of 2.7% and the prior 2.5%. This is the strongest Japanese wage growth reading in this cycle and a powerful signal for the BOJ: sustained wage growth above 3% removes the last major argument against continued monetary normalisation. The yen strengthened on the data, and USD/JPY faces downward pressure — a yen-positive, dollar-negative dynamic that is structurally supportive for gold.
Japan’s Current Account surplus at 2.71T yen — above the forecast of 2.40T and significantly improved from the prior 3.13T (note: a narrowing from prior but still a robust surplus). Japan’s external position remains strong, underpinning the yen’s fundamental case.
Japan’s Economy Watchers Sentiment collapsed to 42.2 — dramatically below the forecast of 48.0 and the prior 48.9. This survey of workers in consumer-facing industries dropped nearly 7 points in a single month — one of the sharpest deteriorations in recent years. The combination of strong wages but collapsing economic sentiment reflects exactly the stagflation dynamic visible in US and European data: incomes are rising but consumers and business owners feel the economy is deteriorating. For the BOJ, this creates a genuine dilemma — normalise rates despite the growth slowdown, or pause and risk losing credibility on inflation.
German Factory Orders m/m at 0.9% — below the forecast of 3.0% but dramatically better than the prior of -11.1%. A significant month-over-month improvement from the depths of last month’s collapse, but still well short of expectations. The prior -11.1% was the worst reading in years — any recovery from that level was expected, but 0.9% versus a 3.0% forecast is a meaningful miss that signals German manufacturing is recovering more slowly than hoped.
UK Halifax HPI m/m at -0.5% — below the forecast of 0.2% and the prior 0.3%. UK house prices fell in March — the first monthly decline in several months and a signal that the housing market recovery seen in the mortgage approvals data earlier this week may be fragile. GBP faces modest downward pressure on this miss.
French Trade Balance at -5.8B — significantly worse than the forecast of -2.4B and the prior -1.8B. France’s trade deficit widened dramatically in February — a combination of weak exports and resilient import demand. For EUR/USD, a widening French trade deficit reduces the euro’s external support and adds to the case for ECB easing.
UK Construction PMI at 11:30am printed at 45.6 — above the forecast of 43.6 and the prior 44.5. A beat, but still deeply in contraction territory. UK construction activity is contracting at a slower pace — not a recovery, but a stabilisation. UK Housing Equity Withdrawal at -13.8B — worse than the forecast of -9.6B — signals households are continuing to reduce equity borrowing, consistent with the cautious consumer environment.
12:00pm — Eurozone PPI and Retail Sales
Eurozone PPI m/m at -0.7% — better (less deflationary) than the forecast of -0.6% but still a significant monthly decline in producer prices. Eurozone producers are receiving lower prices for their output — a disinflationary signal that reduces the ECB’s inflation concern and reinforces the case for continued easing. For EUR/USD, falling producer prices are modestly negative — they reduce the ECB’s motivation to keep rates elevated.
Eurozone Retail Sales m/m at -0.2% — in line with the forecast of -0.2% and a deterioration from the prior 0.0%. European consumers are pulling back — consistent with the weak GfK and Sentix data from earlier this week. The Eurozone consumer is not the growth engine the ECB needs right now.
5:30pm — Crude Oil Inventories: Energy Snapshot
Crude Oil Inventories are forecast to show a draw of -1.0M barrels — a reversal of last week’s 5.5M barrel build. A draw of this size would be modestly supportive for oil prices and would help alleviate the demand concern narrative that has been weighing on WTI since Liberation Day’s global growth slowdown fears. A larger draw (above 3M) would be a significant oil-positive catalyst. A build instead of a draw would be the most bearish oil outcome and could amplify global demand slowdown concerns.
9:00pm — FOMC Meeting Minutes: The Day’s Most Important Event
The FOMC Meeting Minutes at 9:00pm are the most comprehensive account of the internal Fed debate from the March hawkish hold decision — the meeting that triggered gold’s collapse from $5,200 to $4,100. The minutes will reveal the nuance behind the dot plot revision, the extent of the debate about the growth versus inflation tradeoff, and any internal dissent that was not visible in the official statement or Powell’s press conference.
Several specific questions will be answered by the minutes. How many members were genuinely comfortable with the hawkish dot plot versus how many reluctantly agreed? Was there discussion of the softening PMI and consumer sentiment data that emerged in the weeks before the meeting? Did any members raise concerns about the tariff environment and its dual impact on inflation and growth? Was there any discussion of conditions under which the committee would consider cutting rates despite above-target inflation?
For gold, the most market-moving outcome would be minutes that reveal more internal dovish dissent than the public messaging suggested — indicating that the hawkish stance is less unanimous than Powell’s press conference implied. That outcome would force a repricing of the rate cut timeline and provide the strongest single catalyst for gold to break above $4,860 and target $4,900+.
A minutes release that confirms the hawkish consensus was overwhelming — with strong agreement on the dot plot and minimal discussion of growth risks — would be the most challenging outcome for gold, potentially triggering a retreat from $4,797 toward the $4,742 support level.
The most likely outcome is minutes that reveal a Fed that was genuinely uncertain — acknowledging both the inflation persistence and the growing growth risks, with the hawkish outcome representing a close call rather than a clear consensus. That reading would be interpreted as mildly dovish relative to the public messaging and would support gold’s position above $4,779.
FOMC Member Daly speaks at 8:00pm — just one hour before the minutes. Daly’s comments will either preview or diverge from what the minutes contain. Watch for any language around “balanced risks” or “monitoring both sides of the mandate” — these phrases signal a dovish lean that would prime the market for a constructive minutes reaction.
The 10-year US Treasury Bond Auction at 8:01pm (prior yield 4.22%) is also significant — strong demand for Treasuries (lower yield at auction) would be dollar-negative and gold-positive heading into the minutes. Weak demand (higher yield) would do the opposite.
Key Levels and Full Market Summary
- Gold (XAU/USD): $4,797 · Dip target $4,779 · Resistance $4,835–$4,860 · Target $4,900+ · Floor $4,742 · FOMC Minutes 9:00pm is everything
- EUR/USD: French trade deficit miss + Eurozone retail sales weak · PPI deflationary · Dollar direction from bond auction and FOMC Minutes · Dovish minutes = EUR recovers · Hawkish = extends losses
- GBP/USD: Halifax HPI miss + Construction PMI in contraction · Housing Equity Withdrawal worse than forecast · Pair under modest pressure · FOMC Minutes drive the close
- USD/JPY: Japanese wage growth at 3.3% = BOJ normalisation signal = yen support · Economy Watchers collapse = growth concern · Pair likely to drift lower · Dovish FOMC Minutes = sharp fall
- NZD/USD: RBNZ held at 2.25% — rate statement and press conference set NZD tone · Any dovish RBNZ signal = NZD weakness
- S&P 500 / Nasdaq: Gold breakout and geopolitical stabilisation mildly positive for sentiment · FOMC Minutes at 9:00pm = most significant after-hours event · Dovish minutes = overnight gap higher in futures
- US Treasuries: 10-year auction at 8:01pm · Strong demand = yields fall = gold positive · Weak demand = yields rise = gold headwind heading into minutes
- WTI Crude: Oil inventory draw expected (-1.0M) · Iran ceasefire reduces geopolitical premium · Global growth slowdown from tariffs = demand headwind · Net: sideways to mildly positive
- Gold structural bull case: Iran geopolitics + Liberation Day tariff inflation + Fed uncertainty + BOJ normalisation (yen strength, dollar pressure) = multiple concurrent tailwinds · $4,900 is the next target · $5,000 is April’s objective if FOMC Minutes confirm dovish undercurrent
Gold is at $4,797 for a reason. The Iran catalyst was the trigger, but the structural case — tariff inflation, Fed uncertainty, safe-haven demand, and a dollar that is losing the support of the hawkish consensus — is what will determine whether $4,860 breaks and $4,900 becomes the next target. Tonight’s FOMC Minutes write the next chapter. A dovish undercurrent in the March Fed debate is the catalyst gold needs to confirm that the post-$5,200 correction is over and the next leg higher has begun.
Analysis based on the XAU/USD 15-minute chart as of April 8, 2026, 12:20 UTC+3. Economic data sourced from the daily macro calendar. This article is for informational and educational purposes only and does not constitute financial advice.