
Gold trades cautiously bullish at $4,327 on Wednesday, June 17, 2026 — consolidating inside a well-defined intraday channel as markets brace for the most consequential Federal Reserve event of the year. The rate decision itself is fully priced in, with this week’s hub analysis identifying the FOMC as the dominant driver for the June 15–19 session. Today’s outcome hinges not on whether the Fed holds, but on what Chair Kevin Warsh signals about the path ahead in his first press conference as Chair.
Key Levels
- Bias: Cautiously Bullish above $4,319
- Support: $4,319 → $4,309
- Resistance: $4,331 → $4,338 → $4,355
- Session target: $4,355–$4,365 (conditional on dovish FOMC tone or unchanged dot plot median)
- Invalidation: Below $4,309 = channel base lost, bearish bias shift toward $4,280
Catalyst of the Day: FOMC Decision, Dot Plot, and Warsh’s First Press Conference
The Federal Open Market Committee announces its rate decision at 21:00 UTC+3 tonight, accompanied by the updated Summary of Economic Projections and the new dot plot. Markets assign a 97% probability to a hold at 3.50%–3.75%, making the rate decision itself a non-event for gold. The real pivot risk lies in the dot plot: if the median projection shifts to signal one rate hike by December, real yields are likely to firm and gold faces near-term headwinds. If the median holds steady or signals rate cuts back on the table, gold’s consolidation resolves to the upside. Chair Warsh’s press conference follows at 21:30 UTC+3 — his first as the 17th Fed Chair — and every word on inflation tolerance, the Iran conflict’s energy impact, and the pace of future policy adjustment will carry outsized weight for gold positioning.
Fundamental Context
The macro backdrop entering today’s FOMC is complex for gold. US headline CPI reached 4.2% in May 2026 — its highest reading since April 2023 — driven by a 23.5% energy surge linked to the Iran conflict, while core CPI held at 2.9%. Elevated inflation normally pressures gold via higher nominal yields, but the source matters: a geopolitical energy shock constrains the Fed’s ability to hike without risking recession, keeping the policy path ambiguous and gold supported by uncertainty. Real yields, not headline inflation, drive gold — and until Warsh clarifies the Fed’s reaction function tonight, the gold market is in a holding pattern.
UK CPI data released at 09:00 UTC+3 today carries secondary relevance. The forecast of 3.0% year-on-year represents a re-acceleration from April’s 2.8% reading, with core CPI expected at 2.7%. Persistent UK inflation reinforces the global “higher for longer” inflation narrative that has kept central banks cautious on easing, a dynamic that reduces real yield differentials and lends structural support to gold as a store of value. The data also matters for GBP/USD: a stronger-than-expected print would firm sterling and add indirect downward pressure on the DXY, creating a mild tailwind for dollar-priced gold. Additionally, US Retail Sales data at 15:30 UTC+3 provides one final read on consumer health before the FOMC statement. A soft print increases the probability of a dovish tone from Warsh tonight; a beat reinforces the case for caution on rate cuts.
Central bank demand continues to provide a structural floor beneath gold. Global central banks purchased a net 244 tonnes in Q1 2026, with China adding to reserves for 18 consecutive months. This consistent institutional demand means material gold price weakness continues to attract physical buyers, limiting the downside even in hawkish policy scenarios.
Chart Analysis
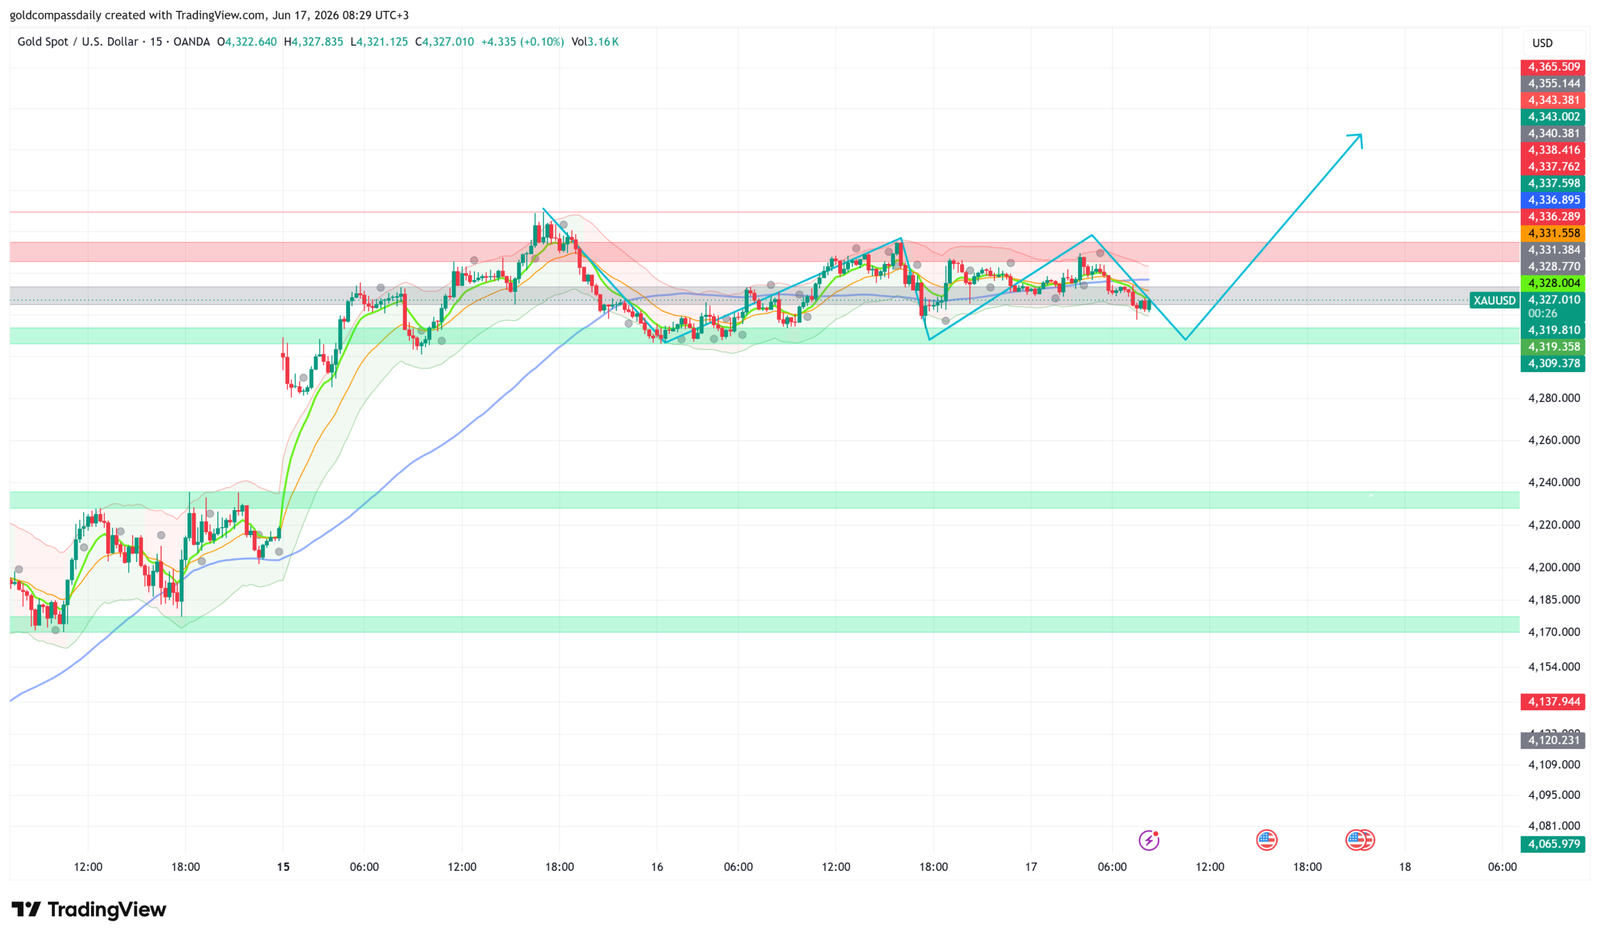
The 15-minute XAU/USD chart as of 08:29 UTC+3 on June 17 shows gold consolidating within a clearly defined sideways channel, with the price currently sitting at $4,327 — just below the channel midpoint and the grey VWAP band around $4,328. The chart depicts a V-shaped recovery off the early-session low near $4,309, with the projected path annotated as a dip toward the $4,319–$4,309 demand zone before a breakout attempt toward $4,355–$4,365. The EMA stack is compressed and largely flat in the near term, consistent with the indecision ahead of tonight’s event. Key resistance clusters on the right-side price ladder confirm $4,331 as the first ceiling, followed by $4,338 and $4,343. The annotated breakout arrow targets the $4,355–$4,365 supply zone, which aligns with chart-visible resistance levels labeled on the right axis. Support at $4,319 and $4,309 are confirmed by the green demand band visible on the chart. As flagged in yesterday’s analysis, the $4,319 level remains the key intraday reference for bullish continuation.
Bull and Bear Scenarios
Bull Trigger
FOMC dot plot holds steady (no new hike signal) and Warsh adopts a neutral-to-dovish tone on the rate path → Gold breaks above $4,331 on momentum, targeting $4,355 intraday with a session extension toward $4,365 if volume confirms the breakout.
Bear Trigger
Dot plot shifts median to one hike by December 2026, or Warsh signals explicit concern about re-accelerating inflation → Gold loses $4,319 support, breaks below channel base at $4,309, and decelerates toward the $4,280 area. A close beneath $4,309 shifts the intraday bias bearish heading into Thursday.
Events Ahead
- Wednesday 09:00 UTC+3 — UK CPI y/y (forecast 3.0%): Re-acceleration above prior 2.8% would reinforce global inflation persistence, a structural gold positive via reduced rate-cut expectations globally.
- Wednesday 15:30 UTC+3 — US Core Retail Sales m/m (forecast 0.6%): Soft data increases FOMC dovish lean; a beat supports yields and weighs on gold pre-decision.
- Wednesday 16:30 UTC+3 — President Trump Speaks: Rhetoric on Fed independence or rate policy could amplify post-FOMC gold volatility.
- Wednesday 21:00 UTC+3 — FOMC Rate Decision + Dot Plot + Economic Projections: Rate expected unchanged at 3.50–3.75%; dot plot median and growth/inflation forecasts are the primary gold mover.
- Wednesday 21:30 UTC+3 — FOMC Press Conference (Warsh): First press conference as Fed Chair; tone on cuts timeline and inflation tolerance is the decisive gold catalyst for the week.
- Thursday — G7 Meetings continue: Communiqué language on trade, geopolitics, or dollar policy could extend gold’s directional move post-FOMC.
New York Session Update
Price Check
Gold trades at $4,333 as the New York session enters its critical pre-FOMC window, confirming the bullish bias outlined in Gold Compass Daily’s morning analysis. Price has broken decisively above the morning’s channel ceiling at $4,338, with the intraday structure now targeting the $4,400 area ahead of tonight’s Federal Reserve decision.

What Changed
US Retail Sales for May came in below forecast, with core retail sales printing at 0.6% month-on-month against a prior reading of 0.7% — a marginal miss that reinforced the case for a neutral-to-dovish FOMC tone tonight. The soft consumer data modestly weighed on the DXY and supported gold’s break above the morning resistance cluster at $4,337–$4,338. Price action since the European open has been constructive: gold printed a higher low near $4,319 early in the session, bounced cleanly off the demand zone, and has since consolidated above VWAP around $4,333–$4,336. The operative channel has shifted upward — the intraday range is now defined between $4,320 support and $4,400 resistance, with the chart’s annotated breakout projection pointing squarely at the $4,382–$4,400 supply zone. All attention now turns to the 21:00 UTC+3 FOMC statement and dot plot, followed by Chair Warsh’s press conference at 21:30 UTC+3.
Updated Levels
- Current price: $4,333
- Bias now: Cautiously Bullish — unchanged, with upward channel shift confirming morning thesis
- Updated support: $4,328 → $4,319
- Updated resistance: $4,338 → $4,355 → $4,374 → $4,383
- NY session target: $4,374–$4,383 (dovish dot plot) / $4,400 extended (Warsh neutral tone confirmed)
Scenarios Into the Close
Bull: FOMC dot plot holds median steady with no new hike signal and Warsh adopts a balanced tone → gold breaks above $4,338 with momentum toward $4,374 initially, extending to $4,383–$4,400 on confirmed dovish read.
Bear: Dot plot shifts median to signal one December hike or Warsh strikes a hawkish tone on inflation → gold loses $4,328 support and retraces toward $4,319, with a close below that level opening $4,309 and invalidating the bullish channel structure.
Chart Analysis
The 15-minute XAU/USD chart as of 15:59 UTC+3 shows price at $4,333, sitting just above the VWAP grey band at $4,332–$4,336 and consolidating tightly ahead of the event. The EMA stack has flattened and compressed, a classic pre-catalyst coil. The annotated chart path projects a brief dip toward the $4,328 demand zone before a sharp impulsive leg higher targets the $4,374–$4,383 supply cluster visible on the right-axis price ladder, with the extended arrow pointing toward $4,400. The green demand band on the chart at $4,328–$4,331 is now the critical intraday floor — a hold there into the FOMC announcement keeps the bullish scenario fully intact. The prior resistance cluster at $4,337–$4,340 has effectively become near-term support on any pullback. Volume has picked up relative to the morning session, consistent with institutional pre-positioning ahead of a high-impact event.
Analysis based on the XAU/USD 15-minute chart as of June 17, 2026 at 08:29 UTC+3. This article is for informational and educational purposes only and does not constitute financial advice.