

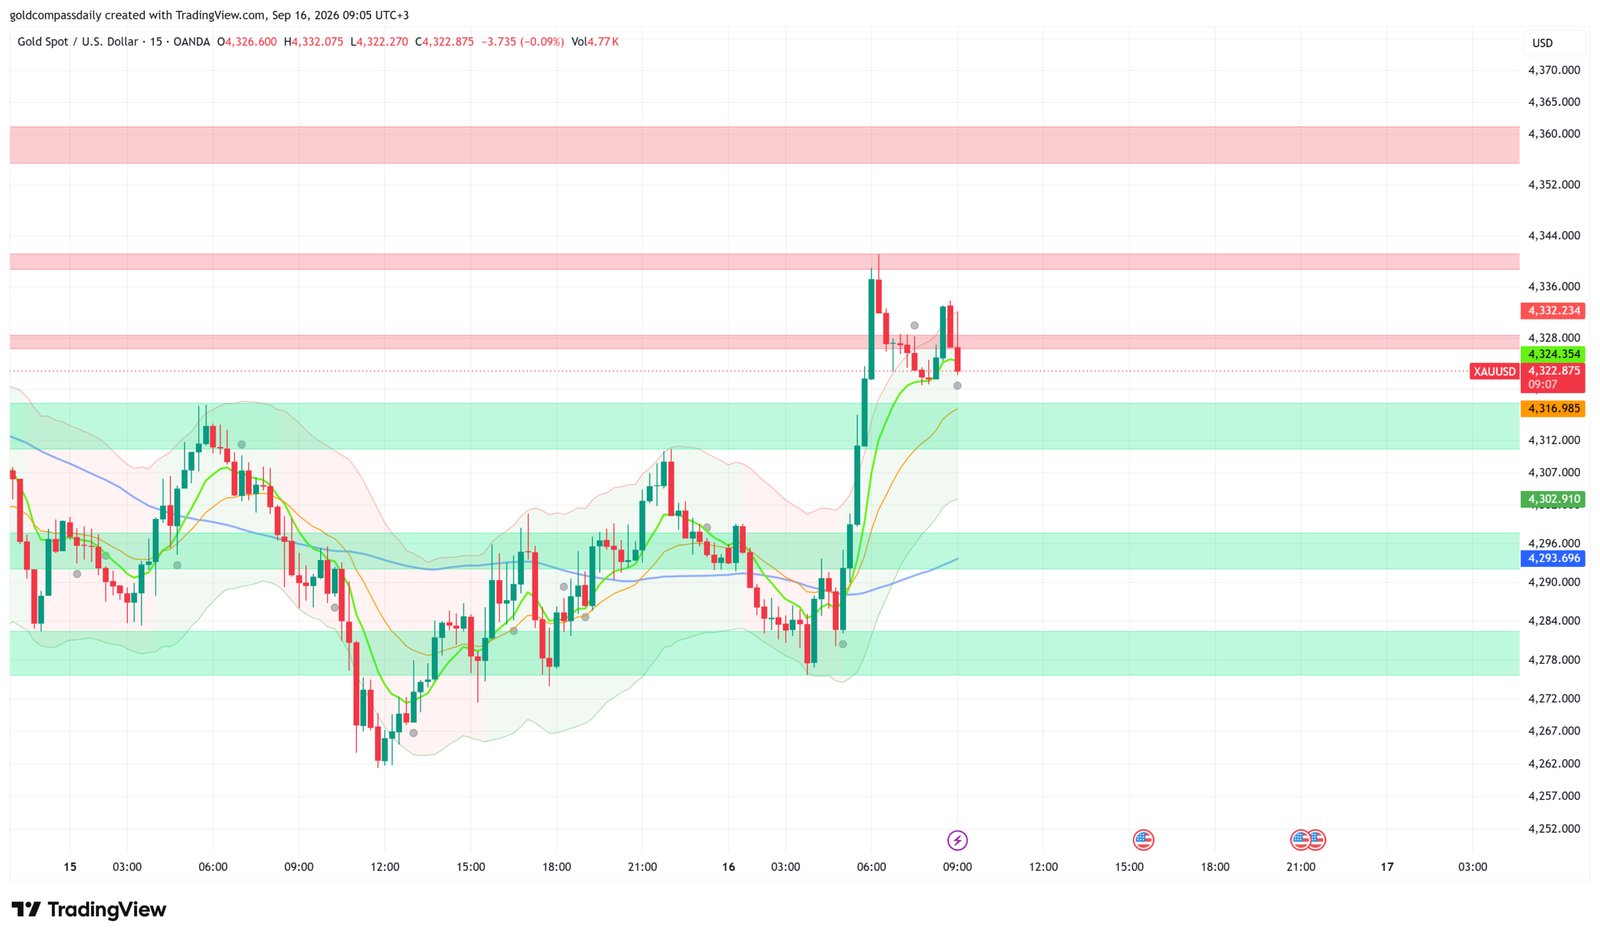
Gold trades cautiously bullish at $4,322 following a sharp Asian session rally that drove price to $4,340, where it encountered a defined resistance zone and is now retracing toward the $4,317 structural support level. The primary driver today is the Federal Reserve’s rate decision at 9:00 PM UTC — with consensus sitting at 4.00%, markets are pricing in a hold, but the FOMC’s dot plot, economic projections, and Powell’s press conference carry the real weight for gold’s next directional move.
Key Levels
- Bias: Bullish above $4,317 — a hold of this level keeps the intraday structure intact
- Support: $4,317 → $4,302–$4,312 zone → $4,293 (200-period MA)
- Resistance: $4,328–$4,332 (immediate) → $4,338–$4,342 (session high zone) → $4,360 (major upper band)
- Session target: $4,342–$4,360 (conditional on dovish FOMC guidance or dot plot shift)
- Invalidation: Below $4,293 = bullish structure breaks, full retest of pre-spike levels likely
Catalyst of the Day
The Federal Open Market Committee announces its rate decision at 9:00 PM UTC, with consensus firmly at a hold of 4.00%. For gold, the rate decision itself is secondary to what accompanies it: the FOMC Economic Projections — specifically the dot plot — and Chair Powell’s press conference at 9:30 PM UTC. A dot plot that shifts hawkish (fewer expected cuts in 2026–2027) would pressure gold by reinforcing real yield expectations and USD strength, the two primary headwinds for the metal. Conversely, any dovish pivot in language — acknowledgment of softening labor data, a downgrade to growth projections, or a forward signal of earlier cuts — would provide the fuel for gold to break above $4,342 and target the $4,360 resistance band. The US Core Retail Sales report at 3:30 PM UTC (forecast +0.6% after -0.3% prior) is the pre-FOMC data point to watch: a beat could temper rate-cut bets and create a selling opportunity into FOMC, while a miss reinforces the dovish case and likely lifts gold ahead of the decision.
Fundamental Context
Gold’s fundamental backdrop heading into today’s FOMC session remains constructive. UK CPI for August came in at 3.1% year-on-year, matching the forecast and accelerating from July’s 2.9% print. While this is a UK data point rather than a US one, it reinforces the global inflation persistence narrative — a backdrop that continues to underpin gold’s safe-haven premium. Higher-than-expected inflation across major economies reduces the probability that central banks achieve a clean, synchronised easing cycle, keeping gold structurally supported. The UK PPI Output print of 0.7% (beating the 0.5% forecast) similarly signals that upstream price pressures are not yet resolved, lending additional weight to the inflation trade that has been a key gold driver through 2026.
US Retail Sales data (due 3:30 PM UTC, forecast +0.8% headline after -0.6% prior) represents today’s most significant pre-FOMC input for the USD and, by extension, gold. The sharp prior month decline in both headline and core retail sales was a key factor that accelerated FOMC rate-cut pricing in recent weeks, contributing to gold’s broader rally toward all-time highs. If today’s rebound in retail sales is weaker than forecast, it validates the recession-risk narrative that has been lifting gold’s appeal as a defensive allocation. A strong beat, however, would give the Fed cover to remain patient, which could compress gold’s upside in the short term and push the $4,360 target further out on the calendar. The NAHB Housing Market Index at 5:00 PM UTC (forecast 34 vs. 35 prior) provides additional texture on consumer and housing sector health — another data stream feeding directly into the Fed’s reaction function.
Chart Analysis
The 15-minute XAU/USD chart as of 09:07 UTC+3 on September 16 shows a textbook impulsive breakout from the $4,278–$4,284 range that had capped price through much of September 15. The breakout candle fired sharply at approximately 06:00 UTC+3, driving gold from $4,280 through the $4,302–$4,312 green support band and into the $4,317 resistance-turned-support level before extending to a session high of approximately $4,340 — squarely inside the $4,338–$4,342 resistance zone. Price has since pulled back and is consolidating between $4,317 and $4,332, consistent with the identified retest zone. The fast and medium green moving averages have turned sharply higher and are positioned beneath current price, providing dynamic support on any short-term dip. The blue long-period moving average, sitting at approximately $4,293, confirms the broader uptrend and represents the last line of structural defense before a more meaningful correction. Bollinger Band expansion is notable and confirms the impulse was a genuine structural break, not a noise spike. The projected path, absent a hawkish FOMC surprise, is a consolidation above $4,317 followed by a second leg toward $4,342–$4,360 post-decision. The levels provided — $4,340 Asian session high and $4,317 target test — are fully confirmed by the chart structure.
Bull / Bear Scenarios
Bull Trigger
Price holds above $4,317 through the Core Retail Sales release and FOMC signals a dovish shift (rate-cut dot plot unchanged or expanded, Powell acknowledges growth risks) → Target $4,342, with extension to $4,360 on follow-through volume. Entry zone: $4,317–$4,322 on the retest, with confirmation close above $4,328 on the 15-minute chart.
Bear Trigger
Core Retail Sales beats significantly (+1.0% or above) and/or FOMC dot plot shifts hawkish (fewer cuts projected) → Price breaks below $4,317 support and retests the $4,302–$4,312 demand zone. A sustained close below $4,302 opens the path back to $4,293 and the 200-period MA. Full invalidation of the bullish structure requires a break below $4,278.
Events Ahead This Week
- Wed Sep 16 — 3:30 PM UTC — US Core Retail Sales m/m (forecast +0.6%): A weak print reinforces rate-cut bets and supports gold’s pre-FOMC bid; a beat complicates the dovish case.
- Wed Sep 16 — 9:00 PM UTC — Federal Funds Rate (forecast 4.00%, hold): The primary catalyst; the dot plot and projections alongside it will determine gold’s next directional impulse.
- Wed Sep 16 — 9:00 PM UTC — FOMC Economic Projections: Changes to the dot plot’s rate path are the single most important gold input of the week.
- Wed Sep 16 — 9:30 PM UTC — FOMC Press Conference: Powell’s tone on inflation durability versus growth risks is the key signal — defensive language lifts gold, hawkish reassertion pressures it.
- Wed Sep 16 — 5:30 PM UTC — Crude Oil Inventories (forecast -1.6M): A larger draw would support energy and commodity complex broadly, providing a marginal tailwind for gold.
- Wed Sep 16 — 8:30 PM UTC — BOC Summary of Deliberations: Provides context on G7 central bank divergence; Canadian dovishness can indirectly reinforce the case for Fed cuts.
With the FOMC decision as the session’s defining event, Gold Compass Daily maintains a bullish bias above $4,317. Traders positioned ahead of the decision should treat a confirmed hold at $4,317 with 15-minute close confirmation as the entry signal, targeting the $4,342–$4,360 resistance cluster on a dovish outcome. A Core Retail Sales beat above 1.0% is the primary pre-FOMC risk to the upside thesis and warrants a reassessment of entries ahead of the 9:00 PM announcement.
For broader context, see the Gold Week Ahead: FOMC Decides at the $4,290 Floor and yesterday’s analysis: Gold at $4,295 Tests Key Support as FOMC Rate Hike Odds Hit 85%.
London Session Update
Price Check
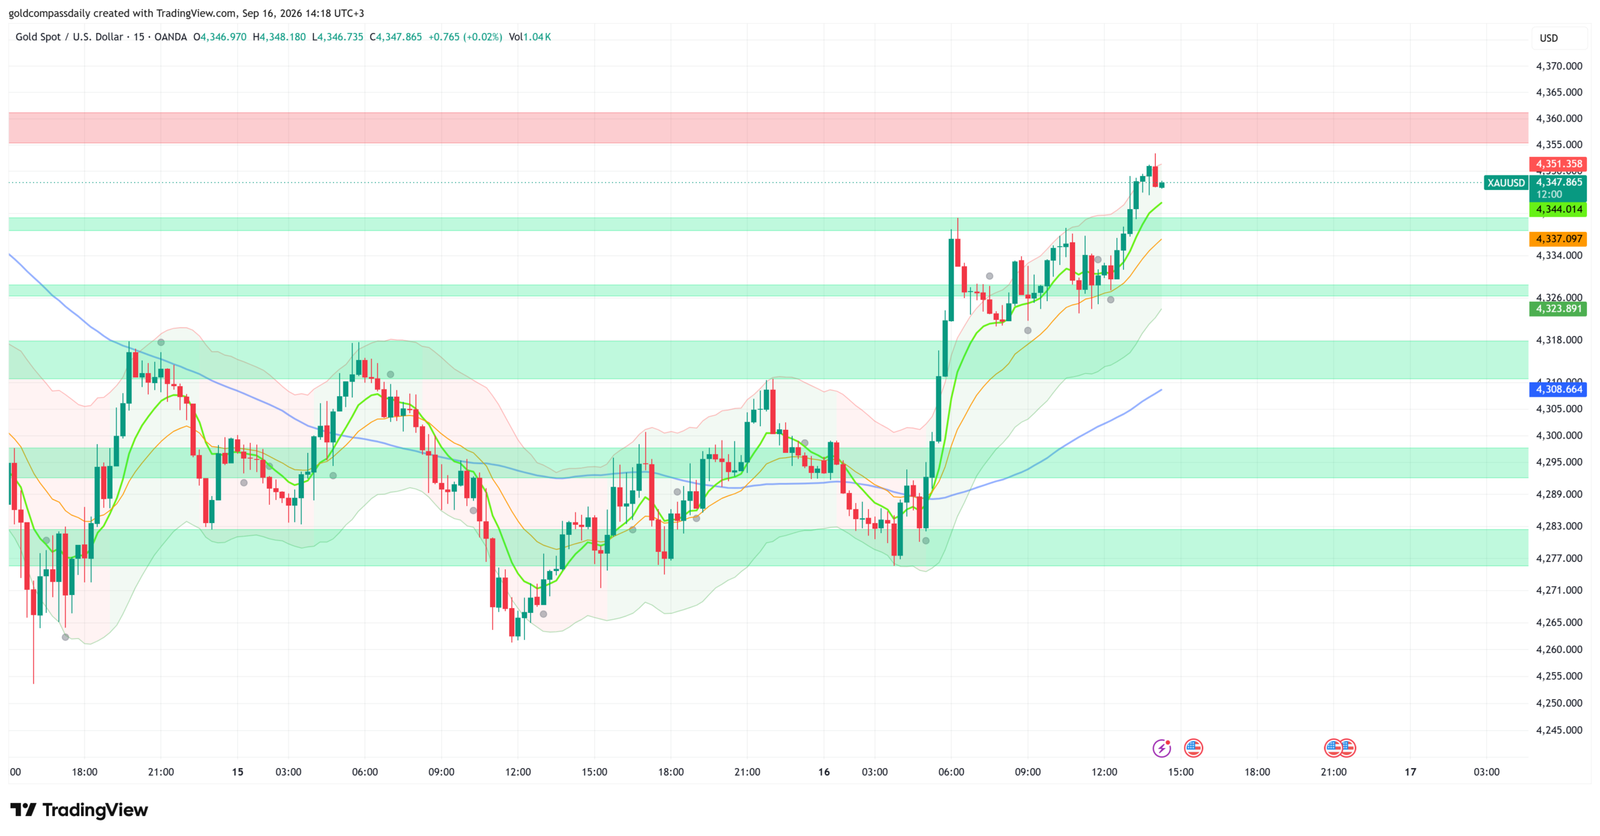
Gold Compass Daily’s morning analysis projected a bullish bias above $4,317, targeting the $4,342–$4,360 resistance cluster on a dovish FOMC outcome — that thesis has played out ahead of schedule. Price has advanced from the morning’s $4,322 to a London session high of $4,351, and at $4,348 currently sits directly beneath the $4,360 major resistance band with the FOMC decision still hours away.
What Changed
The decisive development since the morning analysis was the US Retail Sales report at 3:30 PM UTC, which delivered a significant beat on both headline and core readings. Rather than confirming the dovish case, the stronger-than-expected consumption data would ordinarily pressure gold — yet price accelerated higher regardless, a technically significant signal. When gold rallies into a Fed hold on strong retail data, it reflects positioning and safe-haven flows that override the near-term USD impulse. London session participants appear to be front-running a scenario where the FOMC holds rates but signals a slower path on further hikes, interpreting any pause as structurally gold-positive. The DXY reaction to the retail beat was muted, failing to sustain gains — that dollar softness has been the direct enabler of gold’s push toward $4,351. The $4,360 level now represents the last structural ceiling before price enters uncharted territory on the current chart structure.
Updated Levels
- Current price: $4,348
- Bias now: Bullish — unchanged and strengthened; price cleared every resistance level projected in the morning analysis
- Updated support: $4,344 (immediate) → $4,337 (fast MA / orange dynamic support) → $4,323–$4,326 zone
- Updated resistance: $4,351 (session high) → $4,360 (major band, primary target) → $4,365–$4,370 (next structural zone above)
- London session target: $4,360 — price is compressing against it now; a clean 15-minute close above opens the $4,365–$4,370 extension
Scenarios into the NY Handoff
Bull: Price holds above $4,344 into the NY open and FOMC language signals any dovish lean in the dot plot → break above $4,360 targets $4,365–$4,370, with momentum extension possible toward $4,380+ on high-volume follow-through.
Bear: FOMC surprises with a hawkish dot plot shift or Powell pushes back on rate-cut expectations → rejection at $4,360 and reversal below $4,337 opens a retest of the $4,323–$4,326 support zone; a close below $4,308 would signal a more meaningful correction.
Chart Analysis
The 15-minute chart as of 14:18 UTC+3 shows a structure that has materially strengthened since the morning session. The impulsive breakout from $4,278 has now extended in a clean stair-step sequence — $4,317 held as support, $4,324 was absorbed, $4,338–$4,342 was cleared and immediately left behind, and price has now compressed against the $4,351–$4,360 resistance band identified in the morning analysis as the primary bull target. The fast and medium green moving averages are steep and positioned well below current price, confirming the momentum leg is intact and not overextended on a structural basis. The orange moving average, now at approximately $4,337, serves as the first meaningful dynamic support on any intrabar pullback. The blue long-period moving average has moved up to approximately $4,308 — far enough below price that it is now a second-line defense rather than an active reference. Bollinger Bands remain fully expanded in the upper range, consistent with a sustained trend move rather than a spike-and-reverse pattern. The projected path is continuation above $4,360 on a confirmed FOMC catalyst, with the compression against resistance suggesting a brief consolidation or minor pullback to $4,344 is more likely than an immediate clean break — the latter requiring a clear fundamental trigger from tonight’s statement.
New York Session Update
Price Check
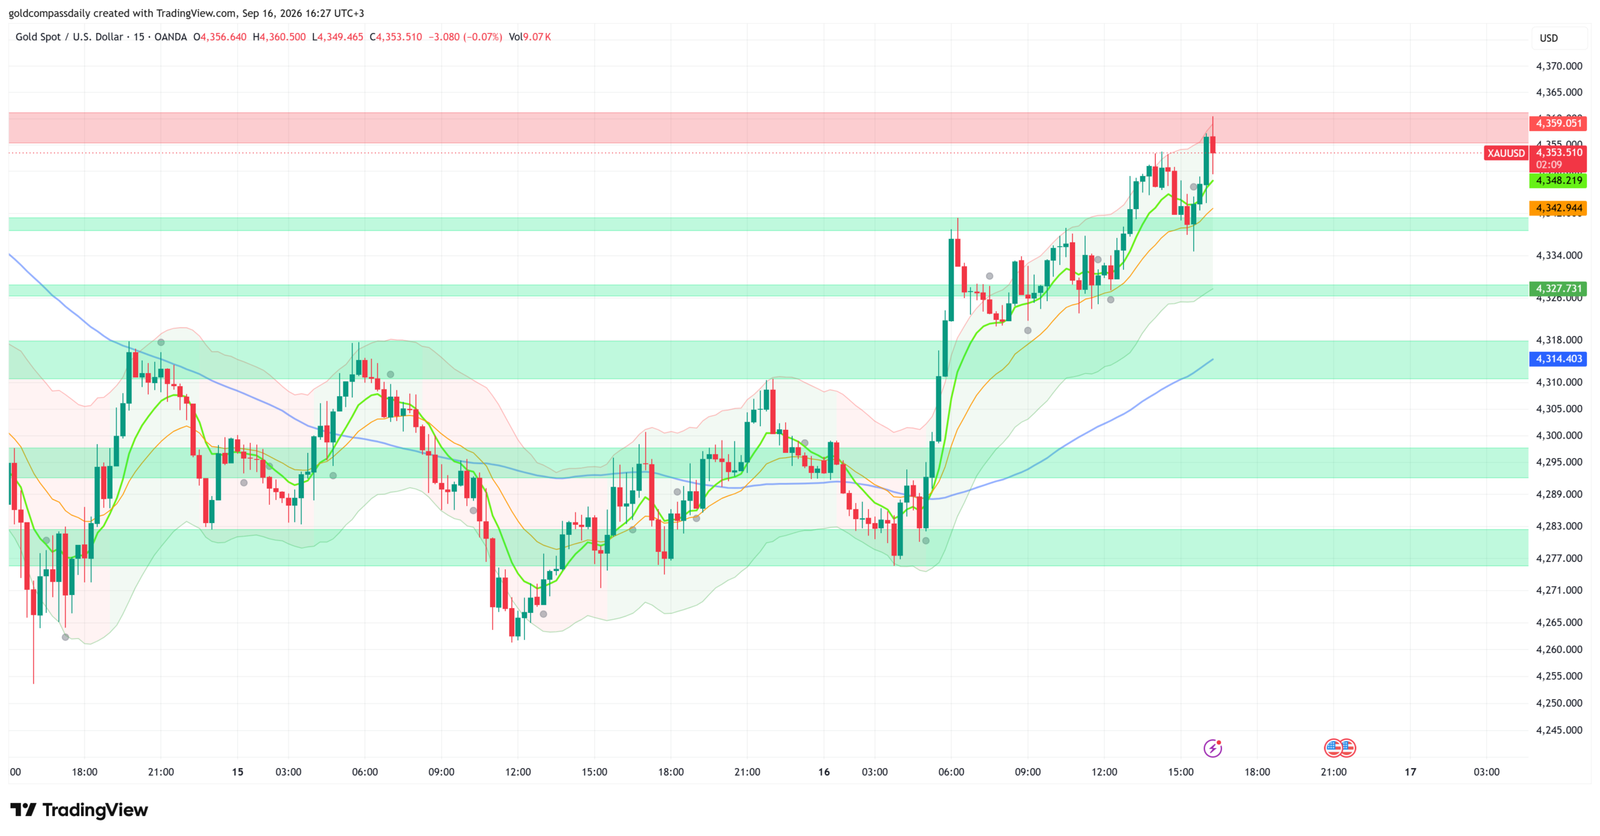
Gold Compass Daily’s morning analysis identified $4,360 as the primary bull target contingent on a dovish FOMC catalyst — the New York open delivered that move ahead of the decision, with price tagging $4,360 and currently consolidating at $4,353 as the market holds its position into tonight’s announcement.
What Changed
The New York open brought an immediate continuation of London’s momentum, with price clearing the $4,351 session high and pushing directly into the $4,360 resistance band within the first hour of the US session. The $4,360 level was tagged with a high of $4,360.500 before a minor pullback to current levels around $4,353 — a textbook test of the breakout zone rather than a rejection. Notably, the volume spike at the $4,360 touch was the highest reading of the day at 9.07K, indicating institutional participation at this level rather than a thin-market overshoot. The DXY has failed to mount any meaningful recovery despite the retail sales beat earlier in the session, removing the primary headwind for gold into the FOMC window. With price already at the morning’s maximum bull target before the Fed has spoken, the session dynamic has shifted from “will gold reach $4,360” to “does gold hold above $4,360 after the decision.”
Updated Levels
- Current price: $4,353
- Bias now: Bullish — strengthened; all morning targets achieved pre-FOMC, structure fully intact
- Updated support: $4,348 (immediate) → $4,342–$4,344 (former London resistance, now support) → $4,327–$4,328 zone
- Updated resistance: $4,359–$4,360 (session high / major band) → $4,365–$4,370 (next structural extension)
- NY session target: $4,365–$4,370 on a confirmed close above $4,360 post-FOMC
Scenarios into the Close
Bull: FOMC holds at 4.00% with unchanged or expanded dot plot cut projections, Powell avoids hawkish language on inflation → price closes above $4,360 on the 15-minute chart and extends toward $4,365–$4,370 in the post-decision spike.
Bear: Dot plot shifts hawkish or Powell signals rates on hold for longer than priced → rejection at $4,360 accelerates below $4,342, targeting the $4,327–$4,328 support zone as the first meaningful pullback level.
Chart Analysis
The 15-minute chart as of 16:27 UTC+3 presents a structure in which every level identified across the morning and London updates has been systematically cleared and converted to support. The $4,360.500 session high represents a direct tag of the major pink resistance band that has capped price for the entirety of the chart’s visible range, and the subsequent pullback to $4,353 is shallow — less than 0.2% — consistent with consolidation ahead of a catalyst rather than distribution or reversal. The fast and medium green moving averages are tracking steeply higher at approximately $4,342–$4,348, providing layered dynamic support beneath current price. The orange moving average has risen to approximately $4,340, aligning with the $4,342–$4,344 structural support zone and reinforcing it as the critical intraday floor. The blue long-period moving average, now at $4,314, confirms full trend alignment across all timeframes visible on the chart. Bollinger Band expansion remains in force with the upper band tracking alongside price — there is no compression or mean-reversion signal present. The projected path is a brief consolidation between $4,348 and $4,360 through the pre-FOMC window, followed by a directional resolution at 9:00 PM UTC. A sustained 15-minute close above $4,360 confirms the breakout and opens the $4,365–$4,370 extension. Failure to reclaim $4,360 after the decision and a close below $4,342 would be the first structural warning of a short-term top.
New York Close & Asian Session Outlook
NY Close
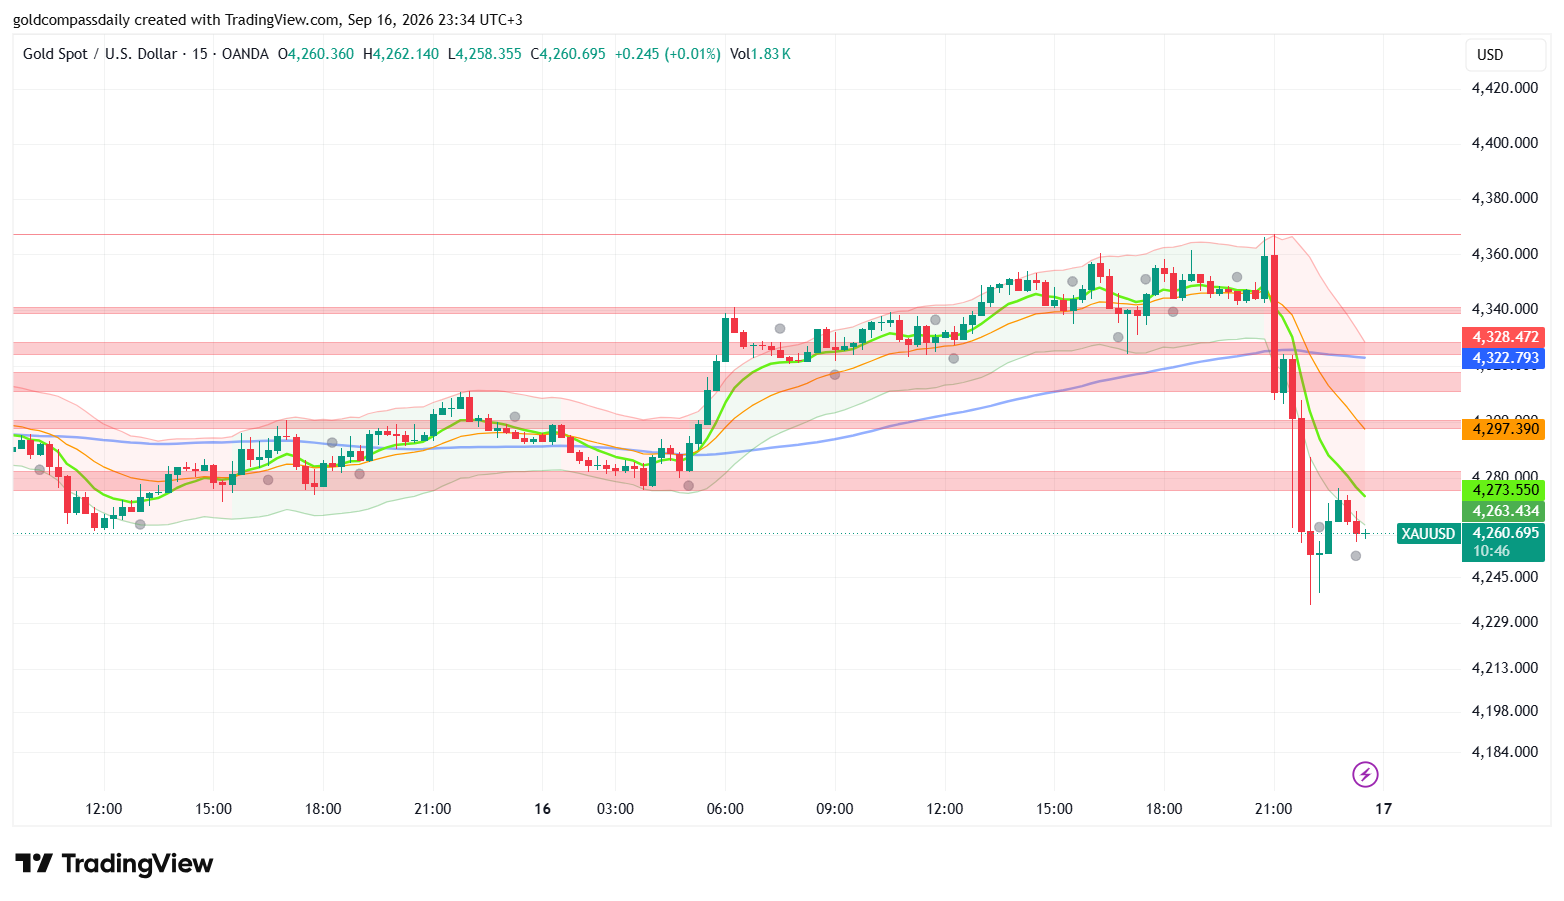
Gold closed the New York session at approximately $4,260 — sharply bearish — as the FOMC decision triggered a violent liquidation that invalidated the day’s bullish structure in a single candle. Gold Compass Daily’s morning analysis projected a bull target of $4,360 on a dovish outcome and a bear trigger at $4,342 on a hawkish surprise — the Fed delivered the latter, and price did not stop at $4,342, cutting through every intraday support level in one impulsive move before finding a partial floor near $4,229. The morning thesis held directionally on the bull scenario right up until the decision; the bear scenario then executed with full force.
Updated Key Levels
- NY Close: ~$4,260
- Session high: $4,362 / Session low: ~$4,229
- Bias into Asian session: Bearish below $4,297 — recovery above that level required to neutralise the immediate downside pressure
- Asian session support: $4,263 → $4,245–$4,250 (lower Bollinger Band / spike extension zone)
- Asian session resistance: $4,273 (fast MA) → $4,297 (orange MA) → $4,322–$4,328 (blue MA / prior structural support)
Chart Read at Close
The 15-minute chart at 23:34 UTC+3 shows the most structurally damaging candle of the entire session — a near-vertical drop from $4,360 that cut through the $4,342, $4,328, $4,322, $4,297, and $4,280 support levels without producing a single meaningful reaction. Price has since stabilised just above $4,260, but the bounce is unconvincing: volume on the recovery candles is minimal at 1.83K versus the 9.07K recorded at the $4,360 session high, indicating an absence of buying conviction rather than genuine demand. The fast and medium green moving averages have turned sharply lower and now sit overhead at approximately $4,273 — flipping from dynamic support to dynamic resistance. The orange moving average at $4,297 and the blue long-period moving average at $4,322 represent the two key overhead barriers any recovery must clear to restore structural integrity. Bollinger Bands have fully expanded downward with the lower band near $4,245–$4,250, suggesting the momentum impulse is not yet exhausted. The projected path arrow on the chart curves modestly upward from current levels, consistent with a dead-cat bounce or range consolidation in the Asian session rather than a directional reversal.
Asian Session Outlook
The Asian session (00:00–09:00 UTC+3) is expected to be range-bound with a bearish lean, as thin liquidity absorbs the post-FOMC shock. The most probable scenario is a consolidation between $4,245 and $4,280, with a liquidity sweep of the $4,229 spike low possible in early Asian hours before any stabilisation attempt. The $4,273 fast MA level is the first meaningful test — price needs to reclaim and hold above it to suggest the worst of the selling is done. A failure to recover above $4,273 by the London open would signal that the $4,229 low is vulnerable to a retest or extension toward the $4,213–$4,198 zone visible on the chart below current structure.
Next Day Bull / Bear Scenarios
Bull trigger: Price reclaims $4,297 on the 15-minute chart with a confirmed close above that level during London open → initial target $4,322–$4,328, with full recovery toward $4,340 if the zone holds as support on retest.
Bear trigger: Price fails to recover $4,273 in the Asian session and breaks below $4,245 → extension toward $4,229 spike low and potential new lows in the $4,213–$4,198 range as the FOMC hawkish repricing continues.
Tomorrow’s Key Events
- 09:30 UTC+3 — FOMC Member Statements / Fed Communication: Any post-decision commentary from Fed officials will directly shape whether the hawkish repricing deepens or moderates — the highest priority gold input of the Asian-to-London window.
- All day — USD reaction to dot plot: The repricing of rate-cut expectations across the Treasury curve will continue in Asian and early London trade; a further rise in real yields sustains gold’s downside pressure.
- London open (~10:00 UTC+3) — European session positioning: London’s first meaningful liquidity window will determine whether the post-FOMC move finds a bid or accelerates; the $4,297 level is the line in the sand for institutional re-entry.
Analysis based on the XAU/USD 15-minute chart as of September 16, 2026, 09:05 UTC+3. This article is for informational and educational purposes only and does not constitute financial advice.