

Gold trades cautiously bullish at $4,295 — but the chart tells a more complex story. XAU/USD is testing a critical confluence of the $4,296 support zone and the 200-period SMA on the 15-minute chart simultaneously, just 24 hours before the Federal Reserve’s rate decision. A hold here opens the path back to $4,320. A break puts $4,280 in play before the most important central bank event of the quarter.
Key Levels
- Bias: Cautiously Bullish above $4,296 — bearish below
- Support: $4,296 → $4,284
- Resistance: $4,302 → $4,316 → $4,320 → $4,340
- Session target: $4,320 (conditional on $4,296 holding and Empire State data beating at 3:30 PM)
- Invalidation: Below $4,284 = bearish momentum accelerates toward $4,260–$4,263 pre-FOMC flush
Catalyst of the Day
The single priority for Tuesday’s session is the Empire State Manufacturing Index, due at 3:30 PM (UTC+3), alongside the ADP Weekly Employment Change at 3:15 PM. Both feed directly into the Fed’s data dependency narrative ahead of Wednesday’s 85%-priced rate hike. A beat on Empire State (forecast 14.8 vs. prior 20.6) would reinforce the case for a hawkish Fed, strengthen the dollar, and maintain downward pressure on gold through the session. A miss, however — particularly if ADP employment weakens below the 12,000 prior — could revive safe-haven demand and push XAU/USD back toward $4,316–$4,320 before the FOMC blackout fully takes effect. Watch 3:30 PM closely: the next 12 hours of gold price action will be shaped largely by what those two prints deliver.
Fundamental Context
The dominant macro force compressing gold this week is the near-certainty of a Federal Reserve rate hike on Wednesday, September 16. Markets are currently pricing an 85% probability of a 25-basis-point rate increase at the FOMC meeting. That represents a remarkable shift from August 11, when traders saw just a 48.4% probability of an increase — meaning the market has moved from essentially a coin flip to treating a hike as the overwhelmingly likely outcome. The catalyst was inflation: the Bureau of Labor Statistics reported consumer prices rose 3.4% year-over-year in August, while core inflation increased 0.3% from the prior month — matching expectations but providing little evidence that inflation is moving cleanly toward the Fed’s 2% target. Higher rates increase the opportunity cost of holding non-yielding gold directly, and the combination of a firming dollar and elevated Treasury yields continues to suppress the metal’s upside. As of September 11, futures markets are pricing a gradual increase in the federal funds rate to approximately 4.1% by December — a trajectory that, if confirmed by Wednesday’s projections, would keep gold under structural pressure through year-end.
China’s August data, released early Tuesday, delivered a mixed-to-negative read that compounds gold’s near-term headwind by undermining the demand-side support story. Retail sales grew just 0.4% year-on-year in August — slowing from 0.6% in the prior month and missing economists’ forecasts — while fixed asset investment for the first eight months of 2026 shrank 7.2%, deepening from a 6.7% decline in the January-to-July period. Industrial output did beat at 5.2% year-on-year, accelerating from 4.5% in July, but the National Bureau of Statistics acknowledged that the contradiction between strong supply and weak demand remained prominent — making the industrial beat a sign of concentrated strength rather than a broad economic acceleration. For gold, weakening Chinese consumer demand is a direct demand-side negative: China is the world’s largest physical gold consumer, and persistent softness in household spending reduces the floor that jewellery and retail investment demand typically provides. The data removes one argument for a sustained gold recovery ahead of FOMC.
Chart Analysis
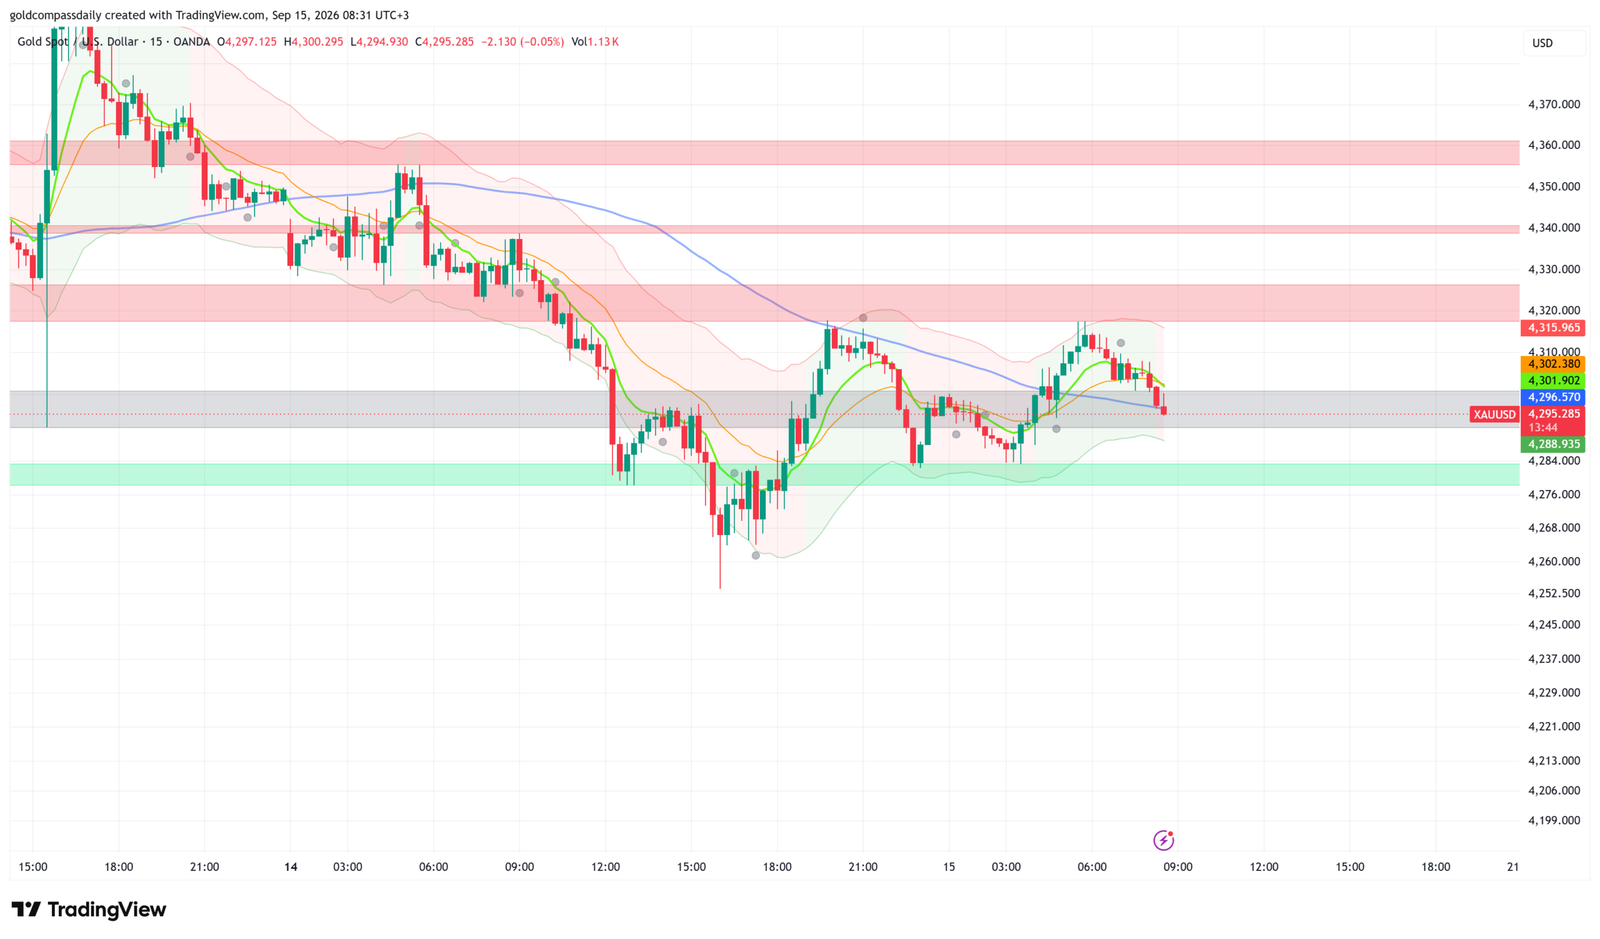
On the 15-minute XAU/USD chart as of 08:31 UTC+3 on September 15, gold is printing at $4,295, directly on the $4,296 dashed support line — a level that has held on at least two prior tests visible in the session. The 200-period SMA (blue line), currently at approximately $4,301–$4,302, has been breached to the downside following the rollover from the $4,315–$4,316 lower high formed earlier in the Asian session. This is technically significant: price is no longer above the 200 SMA and is now attempting to establish itself below it. The grey support band between $4,288 and $4,296 represents the primary battleground, with the green demand zone at $4,284 offering the next structural floor. Resistance now clusters at $4,302 (the 200 SMA re-test level), $4,316 (session swing high), and $4,320 (the upper boundary of the key zone noted ahead of the session). A lower-high formation visible from the Sep 14–15 bounce — price rallied to $4,316 but failed to reclaim $4,320 — keeps the intraday structure bearish until $4,302 is reclaimed and held. For the buy bias to activate, price must close a 15-minute candle above $4,302, confirming the 200 SMA as support rather than resistance. Until that happens, the path of least resistance leans toward a test of $4,284.
Bull and Bear Scenarios
Bull Trigger
Condition: Price closes a 15-minute candle above $4,302, reclaiming the 200 SMA, and either ADP employment or Empire State Manufacturing data miss expectations at 3:15–3:30 PM. Target: $4,316 → $4,320. A sustained break above $4,320 with volume opens $4,340 into the FOMC pre-positioning window Wednesday morning.
Bear Trigger
Condition: Price breaks and closes below $4,284 on the 15-minute chart, confirming a clean breakdown through the grey support band, particularly if Empire State Manufacturing beats expectations and reinforces the hawkish Fed narrative. Target: $4,268 → $4,260. The $4,253 intraday low from Monday, September 14 — the lowest level since August 7 — becomes the next magnet for price if $4,284 gives way cleanly.
Events Ahead This Week
- Tuesday, Sep 15 — 3:15 PM — ADP Weekly Employment Change (prior: 12.0K): A surprise miss would reduce rate hike certainty and could provide short-term gold relief before FOMC.
- Tuesday, Sep 15 — 3:30 PM — Empire State Manufacturing Index (forecast: 14.8, prior: 20.6): Further deceleration in manufacturing conditions would weigh on the dollar and offer gold a temporary lift; a beat reinforces the hawkish path.
- Wednesday, Sep 16 — FOMC Rate Decision + Economic Projections + Press Conference: The week’s defining event. An 85%-priced 25bp hike means the move itself is unlikely to shock; the dot plot projections and Chair Warsh’s tone on the pace of future hikes will determine gold’s directional break. A hawkish dot plot signals $4,260–$4,230. A dovish hike — hold + cautious language — could snap gold back toward $4,340.
- Thursday, Sep 17 — US Initial Jobless Claims + Philadelphia Fed Manufacturing Index: Post-FOMC context data. A claims miss would add to growth concern and could revive gold’s safe-haven bid post-decision.
- Friday, Sep 18 — US Industrial Production (August): Final data point of the week. Relevant to the Fed’s assessment of the real economy’s resilience; a weak print would undermine the case for further hikes and may partially recover gold’s losses if the FOMC reaction was overdone.
Gold Compass Daily maintains a cautiously bullish bias while $4,296 holds, but the risk-reward favors patience: wait for a confirmed 15-minute close above $4,302 before positioning long, and treat any break below $4,284 as a signal to step aside until the post-FOMC landscape becomes clear. Wednesday’s decision will set gold’s trajectory for the remainder of September. For broader context on the week’s macro framework and key levels established Sunday, see the Gold Week Ahead: Sep 14–18, 2026 — FOMC Decides at the $4,290 Floor. Monday’s full session breakdown is available in Gold at $4,331 Tests $4,340 Resistance — FOMC Hike Odds at 85% Set the Week’s Tone.
Analysis based on the XAU/USD 15-minute chart as of September 15, 2026, 08:31 UTC+3. This article is for informational and educational purposes only and does not constitute financial advice.
Federal Reserve Rate Probability Chart | Market-implied probabilities for FOMC rate decisions +5Here’s the full deliverable, ready to paste into your CMS:TITLE: Gold at $4,295 Tests Key Support as FOMC Rate Hike Odds Hit 85%META DESCRIPTION: XAU/USD holds at $4,295 as the 200 SMA breaks on the 15M chart. Cautiously bullish bias — $4,284 is the line in the sand before Wednesday’s FOMC decision.ARTICLE (clean HTML):htmlGold at $4,295 Tests Key Support as FOMC Rate Hike Odds Hit 85%
Gold trades cautiously bullish at $4,295 — but the chart tells a more complex story. XAU/USD is testing a critical confluence of the $4,296 support zone and the 200-period SMA on the 15-minute chart simultaneously, just 24 hours before the Federal Reserve’s rate decision. A hold here opens the path back to $4,320. A break puts $4,280 in play before the most important central bank event of the quarter.
Key Levels
- Bias: Cautiously Bullish above $4,296 — bearish below
- Support: $4,296 → $4,284
- Resistance: $4,302 → $4,316 → $4,320 → $4,340
- Session target: $4,320 (conditional on $4,296 holding and Empire State data missing at 3:30 PM)
- Invalidation: Below $4,284 = bearish momentum accelerates toward $4,260–$4,263 pre-FOMC flush
Catalyst of the Day
The single priority for Tuesday’s session is the Empire State Manufacturing Index, due at 3:30 PM (UTC+3), alongside the ADP Weekly Employment Change at 3:15 PM. Both feed directly into the Fed’s data dependency narrative ahead of Wednesday’s 85%-priced rate hike. A beat on Empire State (forecast 14.8 vs. prior 20.6) would reinforce the case for a hawkish Fed, strengthen the dollar, and maintain downward pressure on gold through the session. A miss — particularly if ADP employment weakens below the 12,000 prior — could revive safe-haven demand and push XAU/USD back toward $4,316–$4,320 before the FOMC blackout fully takes effect. Watch 3:30 PM closely: the next 12 hours of gold price action will be shaped largely by what those two prints deliver.
Fundamental Context
The dominant macro force compressing gold this week is the near-certainty of a Federal Reserve rate hike on Wednesday, September 16. Markets are currently pricing an 85% probability of a 25-basis-point rate increase at the FOMC meeting — a remarkable shift from August 11, when traders saw just a 48.4% probability. The catalyst was inflation: consumer prices rose 3.4% year-over-year in August, with core inflation up 0.3% month-on-month — numbers that matched expectations but provided no evidence that inflation is tracking cleanly toward the Fed’s 2% target. Higher rates increase the opportunity cost of holding non-yielding gold, and the combination of a firming dollar and elevated Treasury yields continues to suppress the metal’s upside. Futures markets are pricing the federal funds rate rising to approximately 4.1% by December — a trajectory that, if confirmed by Wednesday’s projections, would keep gold under structural pressure through year-end.
China’s August data, released early Tuesday, delivered a mixed-to-negative read that compounds gold’s near-term headwind by undermining the demand-side support story. Retail sales grew just 0.4% year-on-year — slowing from 0.6% in the prior month and missing economists’ forecasts — while fixed asset investment for the first eight months of 2026 contracted 7.2%, deepening from a 6.7% decline through July. Industrial output beat at 5.2% year-on-year, but the National Bureau of Statistics itself acknowledged that the divergence between strong supply and weak demand remained prominent — making the industrial upside a sign of concentrated sectoral strength rather than broad economic recovery. For gold, weakening Chinese consumer demand is a direct demand-side negative: China is the world’s largest physical gold consumer, and persistent softness in household spending reduces the floor that jewellery and retail investment demand typically provides. Tuesday’s data removes one argument for a sustained gold recovery ahead of FOMC.
Chart Analysis
On the 15-minute XAU/USD chart as of 08:31 UTC+3 on September 15, gold prints at $4,295 — directly on the $4,296 dashed support line, a level that has held on at least two prior tests visible across the session window. The 200-period SMA (blue line), sitting at approximately $4,301–$4,302, has been breached to the downside following the rollover from the $4,315–$4,316 lower high formed in the Asian session. This is technically significant: price is no longer above the 200 SMA and is now attempting to establish below it. The grey support band between $4,288 and $4,296 is the primary battleground, with the green demand zone at $4,284 offering the next structural floor. Resistance now clusters at $4,302 (the 200 SMA re-test level), $4,316 (session swing high), and $4,320 (the upper boundary of the pre-session key zone). A clear lower-high formation — price rallied from Monday’s lows to $4,316 but failed to reclaim $4,320 — keeps the intraday structure bearish until $4,302 is reclaimed and held on a closing basis. For the buy bias to activate, price must close a 15-minute candle above $4,302, confirming the 200 SMA as support rather than resistance. Until that confirmation arrives, the path of least resistance leans toward a test of $4,284.
Bull and Bear Scenarios
Bull Trigger
Condition: Price closes a 15-minute candle above $4,302, reclaiming the 200 SMA, with ADP employment or Empire State Manufacturing data missing expectations at 3:15–3:30 PM.
Target: $4,316 → $4,320. A sustained break above $4,320 with volume opens $4,340 into the FOMC pre-positioning window Wednesday morning.
Bear Trigger
Condition: Price breaks and closes below $4,284 on the 15-minute chart, confirming a clean breakdown through the grey support band — particularly on an Empire State beat that reinforces the hawkish Fed narrative.
Target: $4,268 → $4,260. The $4,253 intraday low from Monday, September 14 — the lowest level since August 7 — becomes the next magnet if $4,284 gives way cleanly.
Events Ahead This Week
- Tuesday, Sep 15 — 3:15 PM — ADP Weekly Employment Change (prior: 12.0K): A surprise miss would reduce rate hike certainty and could provide short-term gold relief before FOMC.
- Tuesday, Sep 15 — 3:30 PM — Empire State Manufacturing Index (forecast: 14.8, prior: 20.6): Further deceleration would weigh on the dollar and offer gold a temporary lift; a beat reinforces the hawkish path.
- Wednesday, Sep 16 — FOMC Rate Decision + Economic Projections + Press Conference: The week’s defining event. With a hike 85% priced, the surprise factor lies in the dot plot and Chair Warsh’s language on the pace of future increases. A hawkish dot plot signals $4,260–$4,230. A dovish hike — raise now, pause ahead — could snap gold back toward $4,340.
- Thursday, Sep 17 — US Initial Jobless Claims + Philadelphia Fed Manufacturing Index: Post-FOMC context. A claims miss would add to growth concern and may revive gold’s safe-haven bid.
- Friday, Sep 18 — US Industrial Production (August): Final data point of the week. A weak print would undermine the case for further hikes and may partially recover gold’s losses if the FOMC reaction overshoots.
Gold Compass Daily maintains a cautiously bullish bias while $4,296 holds. The risk-reward favors patience: wait for a confirmed 15-minute close above $4,302 before positioning long, and treat any break below $4,284 as a signal to step aside until Wednesday’s decision clears the landscape. For the week’s full macro framework and pre-established key levels, see the Gold Week Ahead: Sep 14–18, 2026 — FOMC Decides at the $4,290 Floor. Monday’s full session analysis is available in Gold at $4,331 Tests $4,340 Resistance — FOMC Hike Odds at 85% Set the Week’s Tone.
London Session Update
Price Check
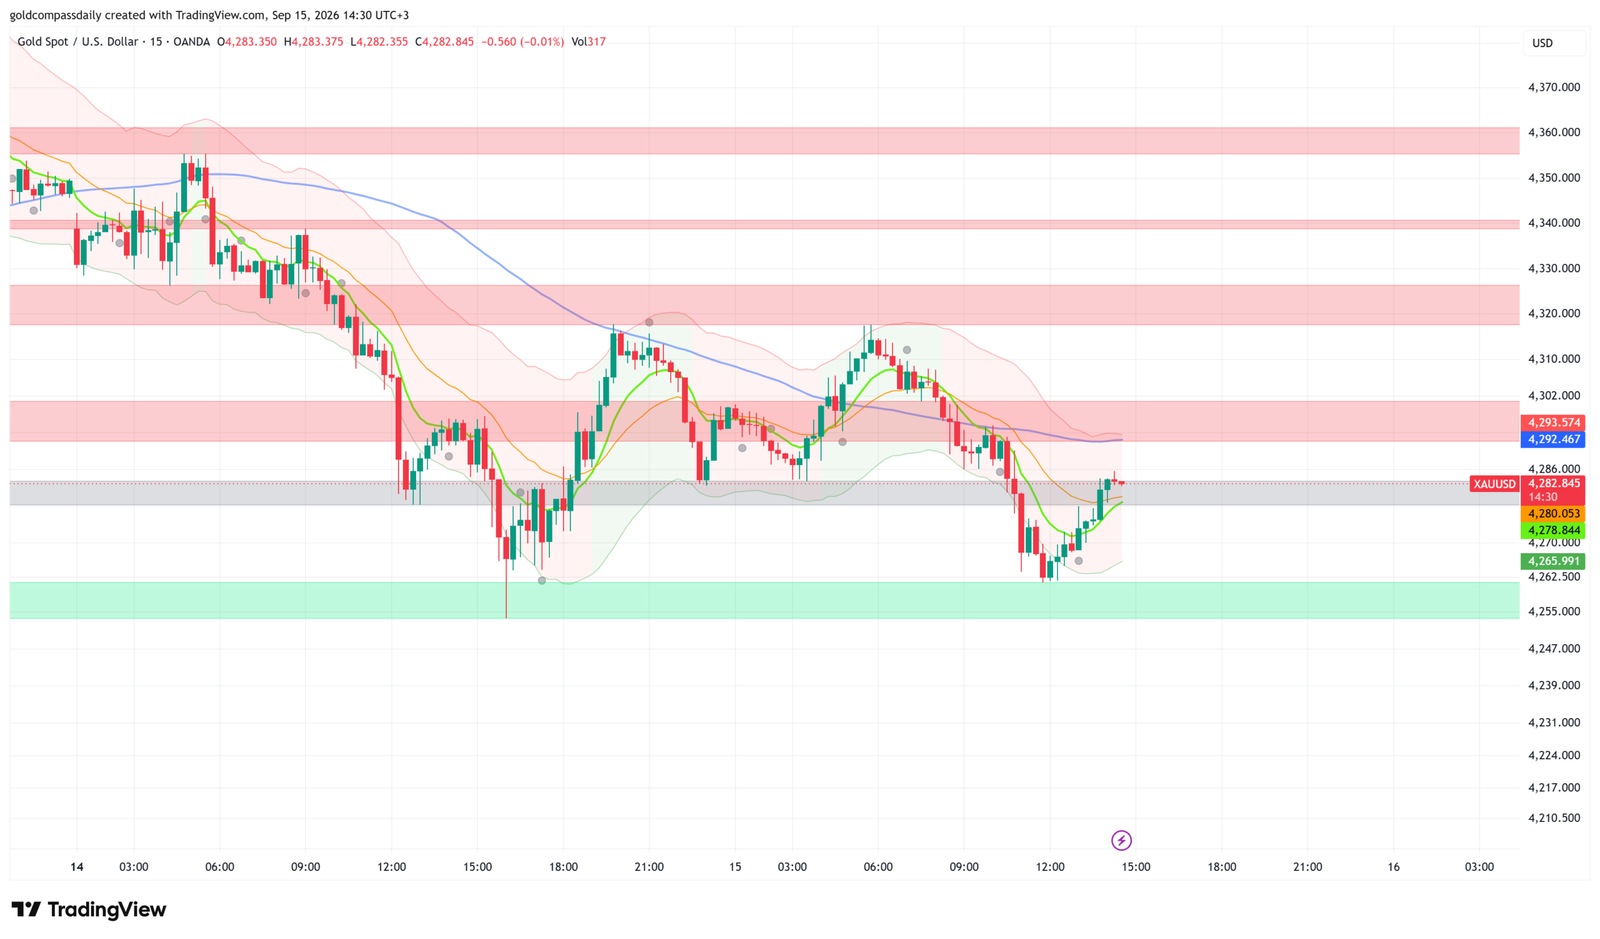
Gold Compass Daily’s morning analysis projected a cautiously bullish bias contingent on price holding $4,296 — that level failed during the London open. XAU/USD has since printed a session low of $4,265 before staging a partial recovery to $4,282, now testing the secondary support band identified on the chart.
What Changed
The London session delivered a clean breakdown of the morning’s key support structure. Price sliced through both $4,296 and the $4,284 invalidation level without meaningful consolidation, triggering the bear scenario outlined this morning. The sell-off accelerated through the European morning as the dollar held firm ahead of tomorrow’s FOMC decision, with no European data catalyst providing gold any counterweight — German ZEW Economic Sentiment and the Eurozone Trade Balance both printed broadly in line with forecasts, offering no surprise to reprice Fed rate expectations. The $4,265–$4,266 green demand zone on the chart absorbed the move, producing a sharp-wick low and the current bounce. That bounce, however, is taking place entirely below the 200 SMA and within a zone that is now acting as resistance overhead rather than support below.
Updated Levels
- Current price: $4,282
- Bias now: Bearish — morning buy bias invalidated below $4,284; bounce is corrective until $4,293 is reclaimed
- Updated support: $4,278 → $4,265–$4,266
- Updated resistance: $4,286 → $4,293 (200 SMA) → $4,302
- London session target: $4,293 on a clean reclaim — otherwise consolidation between $4,278 and $4,286 into the NY handoff
Scenarios into the NY Handoff
Bull: Price closes a 15-minute candle above $4,286 and holds — opens a run toward $4,293 and a potential 200 SMA re-test, with ADP or Empire State data disappointing at 3:15–3:30 PM acting as the trigger. Bear: Price fails $4,278 and reverts toward $4,265 — a second test of the green demand zone ahead of FOMC; a clean break there targets $4,255–$4,250.
Chart Analysis
The 15-minute chart at 14:30 UTC+3 shows XAU/USD at $4,282, sitting inside the grey support band between $4,278 and $4,286 after a decisive sell-off from the $4,310 area during the London morning. The session low of $4,265 found support precisely at the green demand zone visible at the base of the chart, producing a wick reversal candle that halted the decline. The 200 SMA (blue line) has continued to slope lower and now sits at approximately $4,292–$4,293 — a level price has not touched since the breakdown, meaning all recent price action is occurring in bearish territory relative to that moving average. The Bollinger bands (green/orange) have expanded significantly on the sell-off and are beginning to curl, suggesting the impulsive leg may be exhausted for now. However, the structure of the bounce is corrective: no clear higher-high has formed, and the rally lacks the volume or momentum to be classified as a reversal. The path of least resistance into the NY open is a range-bound grind between $4,278 and $4,286, with directional resolution dependent on the 3:15–3:30 PM US data window.
New York Session Update
Price Check
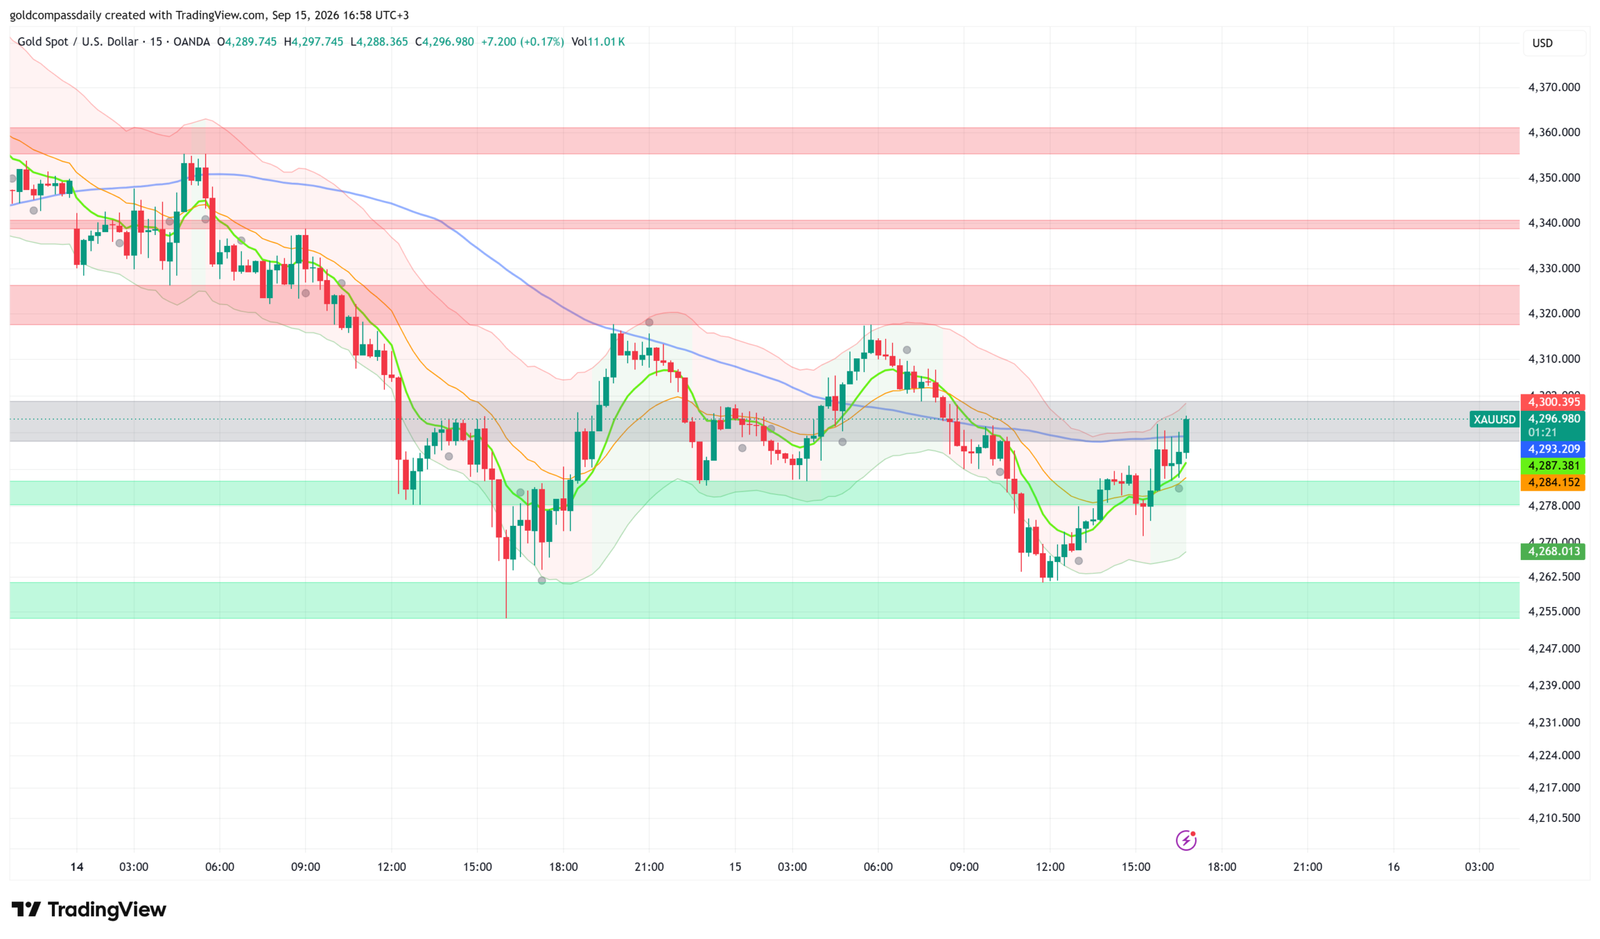
Gold has fully recovered the London session losses and returned to $4,297 — the exact level where the morning analysis opened. The morning’s bull trigger condition, a 15-minute close above $4,302, is now within immediate reach as the NY open drives a sharp surge on volume more than 30 times higher than the London midday print.
What Changed
The New York open has dramatically reversed the London session narrative. The Empire State Manufacturing Index printed at 14.8 — in line with forecasts but a significant deceleration from the prior 20.6 — while the ADP Weekly Employment Change came in soft, adding to the case that the US labour market is cooling at the margins. Neither print was a shock, but together they reinforced the market’s appetite for a one-and-done FOMC hike rather than an extended tightening cycle — and that interpretation is gold-positive. The dollar softened on the data, removing the London session’s primary headwind and enabling the full price recovery. The $4,265–$4,266 green demand zone, identified in the London update as the structural floor, held with precision and has now been confirmed as significant institutional support. The move from low to current price represents a $32 recovery in under three hours — a range that reflects genuine repositioning ahead of tomorrow’s FOMC, not a technical bounce.
Updated Levels
- Current price: $4,297
- Bias now: Cautiously Bullish — reinstated; morning bull trigger activating as price approaches $4,302
- Updated support: $4,284–$4,287 → $4,265–$4,266
- Updated resistance: $4,300–$4,302 → $4,320
- NY session target: $4,302 break and hold → $4,320
Scenarios into the Close
Bull: Price closes a 15-minute candle above $4,302 with volume — the morning’s original trigger activates and $4,320 becomes the NY session target into tomorrow’s FOMC open. Bear: Price stalls at the $4,300–$4,302 resistance band and rolls over below $4,287 — the recovery fades into a pre-FOMC range and the $4,265 low remains the defining level of the session.
Chart Analysis
The 15-minute chart at 16:58 UTC+3 shows XAU/USD at $4,296.98, printing the highest candle of the current recovery leg on volume of 11,010 contracts — the largest single-candle volume visible across the entire two-day chart window. Price has cut back through the green support band at $4,284–$4,287, which is now acting as a confirmed base, and is pressing into the grey resistance zone between $4,293 and $4,302. The 200 SMA (blue line), sitting at approximately $4,293–$4,295, has been reclaimed on this candle — a structural shift from the London session, where all price action occurred below it. The Bollinger bands are expanding upward on the move, confirming momentum rather than mean-reversion. The pattern from $4,265 is a textbook V-recovery anchored by a demand zone hold, and the velocity of the current candle suggests the move has institutional participation rather than retail short-covering alone. The immediate test is $4,300–$4,302: a clean close above that level on the next one or two candles would confirm the morning’s bull scenario with a target of $4,320 before tomorrow’s FOMC open. A rejection here that closes back below $4,287 would reframe the recovery as a liquidity grab ahead of the Fed decision rather than a genuine directional shift.
New York Close & Asian Session Outlook
NY Close
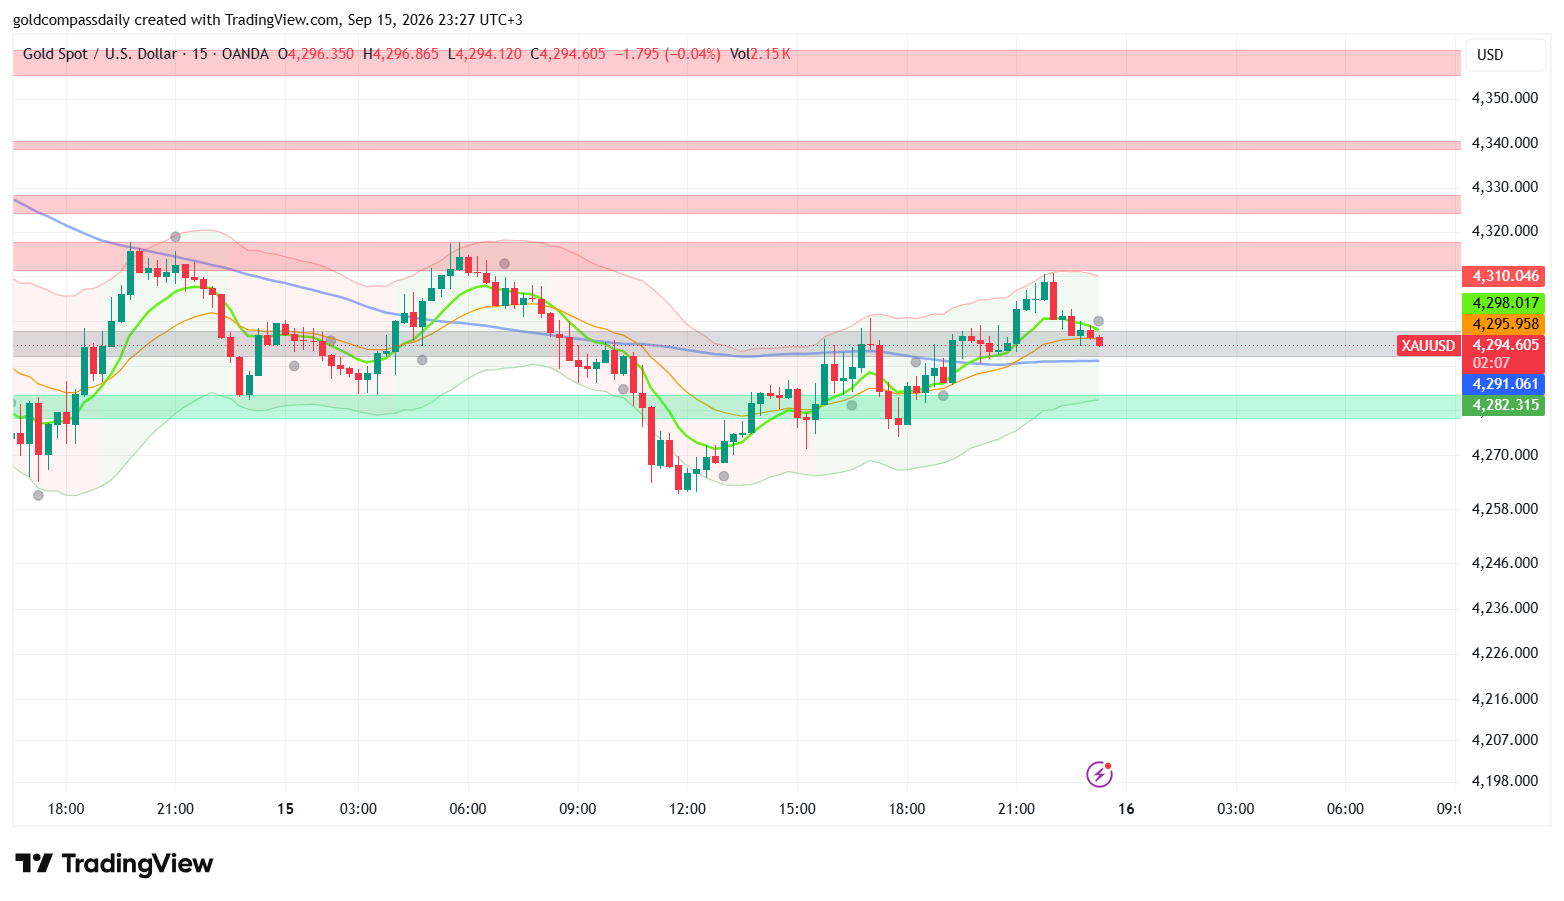
Gold closed the New York session at $4,294 — neutral-to-bullish tone — with the morning’s cautiously bullish bias ultimately vindicated after a volatile intraday journey. The $4,265 demand zone absorbed the London flush, the NY open delivered a $32 recovery to a session high of $4,310, and price is now consolidating just above the 200 SMA heading into the Asian handoff — structurally healthier than at any point since the morning open.
Updated Key Levels
- NY Close: $4,294
- Session high: $4,310 / Session low: $4,265
- Bias into Asian session: Cautiously Bullish above $4,291 (200 SMA)
- Asian session support: $4,291 → $4,282–$4,284
- Asian session resistance: $4,298–$4,302 → $4,310
Chart Read at Close
At 23:27 UTC+3, the 15-minute chart shows XAU/USD at $4,294 in a controlled pullback from the $4,310 session high — the highest level reached since the early Asian session on September 15. The 200 SMA (blue line) has flattened at approximately $4,291–$4,292 and price is holding above it, a meaningful shift from the London session when all price action occurred below the average. The Bollinger bands are contracting after the NY expansion, with the midline sitting at roughly $4,293 — price is essentially coiling around it, typical pre-FOMC behavior as participants reduce position size ahead of tomorrow’s decision. The green demand zone at $4,282–$4,284 remains the structural floor. The closing candle prints a bearish body with a lower wick, suggesting sellers are probing the 200 SMA but buyers are present. No directional conviction is expected until the FOMC release.
Asian Session Outlook
The Asian session is expected to be range-bound between $4,282 and $4,302, with the market entering a de facto pre-FOMC holding pattern. Liquidity is likely to thin significantly after the Tokyo fix, and the most probable behavior is a slow drift toward the $4,291 200 SMA with the possibility of a shallow sweep of the NY close lows toward $4,284 before London opens. A sweep of NY highs above $4,310 is less probable without a specific catalyst — the market has already priced a high probability of tomorrow’s hike and position adjustment ahead of the decision will dominate flow. The level to watch is $4,282: a clean break below it in thin Asian trade would be a warning sign that pre-FOMC positioning is turning defensive.
Next Day Bull / Bear Scenarios
Bull trigger: FOMC delivers 25bp hike with dovish forward guidance — Chair Warsh signals a pause ahead or lowers the projected rate path in the dot plot → gold breaks $4,320 and targets $4,340–$4,360 in the post-decision window.
Bear trigger: FOMC hikes 25bp with a hawkish dot plot projecting further increases through year-end, dollar accelerates → gold breaks $4,282 and targets $4,265 retest, with $4,250 as the extended bear target if the statement signals no pause.
Tomorrow’s Key Events
- Wednesday, Sep 16 — 21:00 UTC+3 — FOMC Rate Decision + Economic Projections: The week’s defining event; 85% probability of a 25bp hike already priced — the dot plot and Chair Warsh’s press conference language on the pace of future hikes will determine gold’s directional break.
- Wednesday, Sep 16 — 21:30 UTC+3 — Fed Chair Warsh Press Conference: More important than the decision itself — any signal of a conditional pause or data-dependency shift is the single most gold-positive outcome possible this week.
- Wednesday, Sep 16 — 15:30 UTC+3 — US Retail Sales (August, forecast +0.3%): Final significant data point before the FOMC blackout lifts; a miss would reinforce the one-and-done narrative and could provide a pre-decision gold lift.
Analysis based on the XAU/USD 15-minute chart as of September 15, 2026, 08:31 UTC+3. This article is for informational and educational purposes only and does not constitute financial advice.