

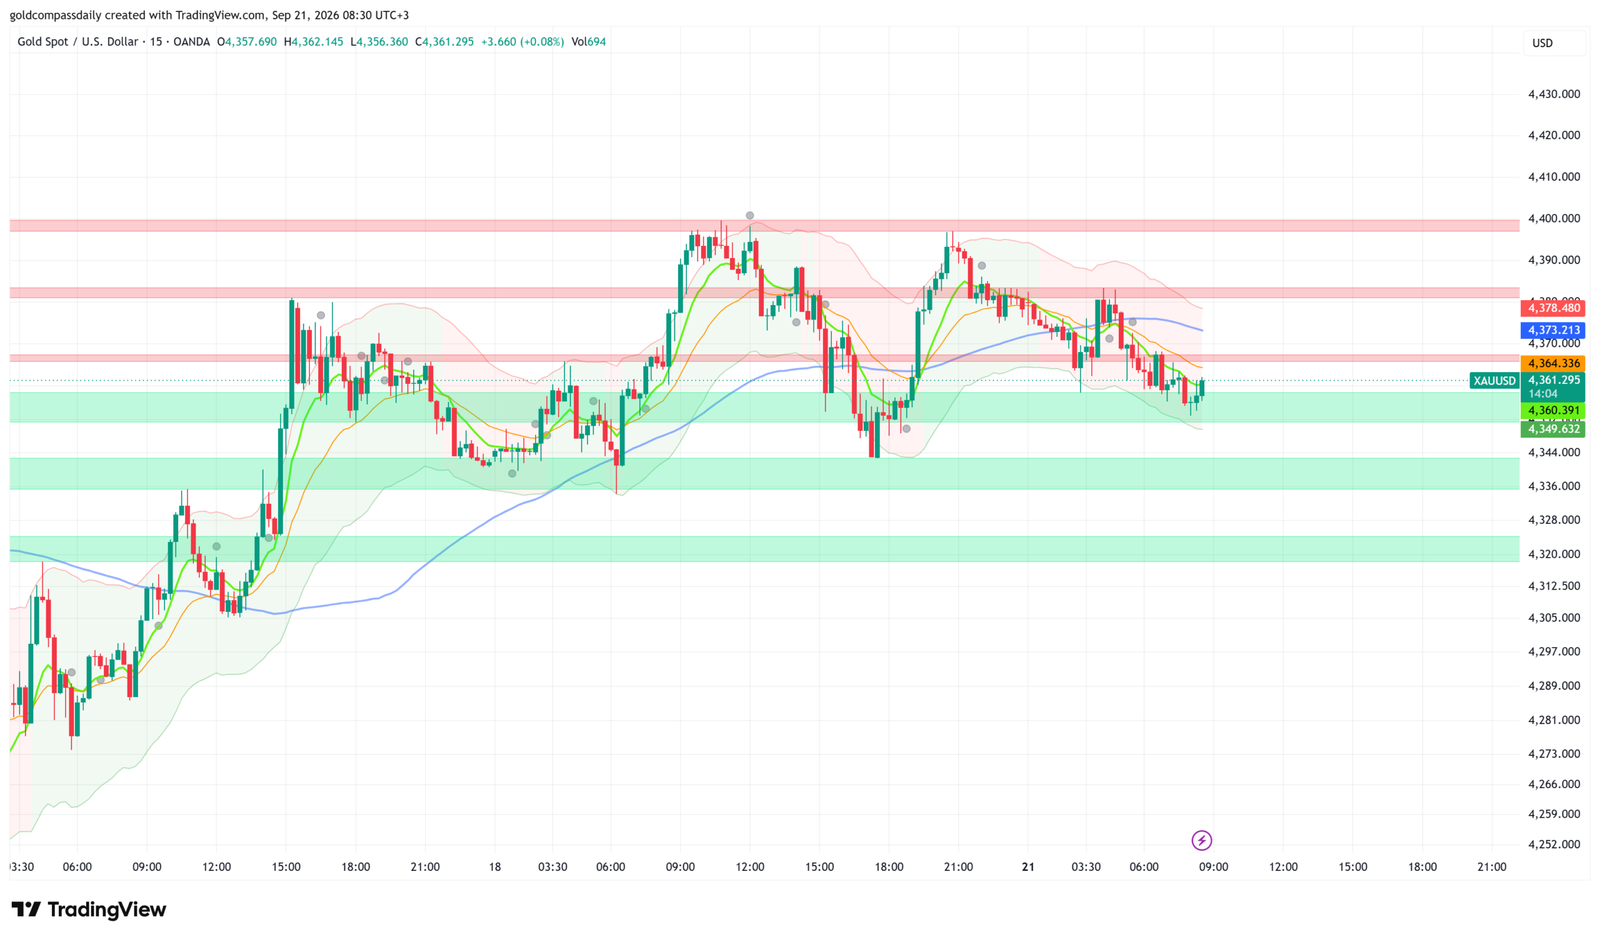
Gold trades cautiously bullish at $4,361 after rejecting the $4,378 resistance zone and settling into a corrective phase that has now found demand between $4,349 and $4,364. The immediate question for Monday’s session is whether the $4,360 demand block holds ahead of FOMC Member Goolsbee’s remarks at 1:30 PM ET — remarks that will set the tone for rate expectations and, by extension, gold’s next directional leg. Gold Compass Daily’s week-ahead analysis flags Fed speakers and PMI data as the twin drivers capable of confirming or undermining last week’s recovery.
Key Levels
- Bias: Cautiously Bullish above $4,360 — structure breaks below this level
- Support: $4,360 → $4,349 → $4,336
- Resistance: $4,364 → $4,373 → $4,378
- Session target: $4,378–$4,400 (conditional on Goolsbee holding a dovish or neutral tone)
- Invalidation: A sustained close below $4,349 shifts the bias to bearish and opens $4,320
Catalyst of the Day
FOMC Member Goolsbee speaks at 1:30 PM ET, and this is the only event on Monday’s calendar that carries meaningful weight for gold. Goolsbee has historically leaned dovish relative to the median FOMC view, and any commentary suggesting the Fed is in no rush to resume rate hikes — or that current policy is sufficiently restrictive — would remove a key headwind from gold by softening real yield expectations. Conversely, a more hawkish tone, particularly one that signals additional tightening remains on the table, would put fresh pressure on gold’s $4,360 support. Market participants should monitor the tone of his language on the inflation trajectory and the neutral rate. A move in DXY above 103.50 following the speech would confirm a hawkish read; a DXY decline below 103.00 would support gold’s recovery case.
Fundamental Context
Gold’s fundamental backdrop remains constructive heading into the final week of September. The Federal Reserve held rates steady at its most recent meeting, but the path forward is contested: markets are pricing a terminal rate below current levels, while several FOMC members continue to push back on early-cut expectations. This tension keeps real yields elevated relative to the post-2022 norm — a structural headwind for gold — but it also means any softening in that narrative carries outsized upside for XAU/USD. Gold Compass Daily reported in Friday’s analysis that gold had cleared $4,364 intraday and was targeting new highs, validating the bullish structure that remains in place on the higher timeframes.
The broader macro picture supports gold’s position as a structurally bid asset. Central bank demand globally remains well above pre-2022 averages, and institutional projections from Goldman Sachs and JPMorgan continue to cite gold as a preferred hedge against fiscal deterioration and geopolitical risk premium. The dollar’s strength in recent weeks has compressed gold’s upside potential in the short term, but it has not altered the medium-term bid beneath the market. With the German Bundesbank Monthly Report also due at 1:00 PM ET and ECB President Lagarde speaking at 6:00 PM ET, the EUR/USD cross will be in focus — a weaker euro would support dollar strength and add marginal headwind to gold, while any dovish signal from Lagarde relative to the ECB’s terminal rate path would ease that pressure.
Chart Analysis
The 15-minute chart shows gold printing at $4,361.295 after a clear structural rejection from the $4,378 resistance zone — a level that capped price on multiple tests across Friday and early Monday. Price has since pulled back into a well-defined demand cluster between $4,349 and $4,364, with the current candle attempting to stabilize at the lower end of this zone. The 20-period EMA (green) has crossed below the 50-period EMA (orange), consistent with short-term corrective pressure, while the slower 200-period MA (blue) continues to slope upward and is currently positioned near $4,373, acting as a dynamic resistance level above price. The Bollinger Bands have narrowed, suggesting the corrective compression is approaching a resolution point. The structure of lower highs from the $4,400 peak and the current test of $4,360 confirms that price is in a consolidation-correction phase rather than a trend reversal — as long as $4,349 holds on a closing basis. A reclaim of $4,364 on volume would shift short-term momentum back to the bulls and set up a retest of $4,373–$4,378. The broader support zone at $4,320 remains the structural floor on any deeper correction.
Bull and Bear Scenarios
Bull Trigger
Condition: Gold closes a 15-minute candle above $4,364 on expanding volume, or Goolsbee’s 1:30 PM ET remarks signal no urgency for additional Fed tightening.
Target: $4,373 first, then $4,378 — a sustained break above $4,378 reopens the path toward $4,400 and beyond, consistent with Friday’s analysis.
Bear Trigger
Condition: A sustained break and close below $4,349, confirmed by a hawkish Goolsbee tone and a rising DXY.
Target: $4,336 initial support, with extension risk toward the $4,320 demand zone if the $4,349 level gives way on strong volume. This scenario would require a structural reassessment of the near-term bullish thesis.
Events Ahead This Week
- Monday, 1:30 PM ET — FOMC Member Goolsbee Speaks: Primary session catalyst; his tone on inflation and the rate path will directly move gold.
- Monday, 6:00 PM ET — ECB President Lagarde Speaks: EUR/USD impact affects the DXY, which applies inverse pressure on XAU/USD.
- Monday, 6:05 PM ET — BOC Governor Macklem Speaks: Secondary catalyst; broad central bank tone matters for risk appetite and dollar positioning.
- Tuesday — Flash PMI Data (US, EU, UK): Contraction readings would boost gold’s safe-haven demand; expansion would support the dollar and add headwind.
- Wednesday — US Durable Goods Orders: A miss strengthens the case for Fed patience; a strong print would pressure gold’s rate-sensitive bid.
- Thursday — US GDP (Final Q2) + Jobless Claims: Confirms or softens the Fed’s “soft landing” narrative; critical for real yield direction.
- Friday — US PCE Deflator (Core): The Fed’s preferred inflation gauge — this is the week’s highest-impact data release for gold.
London Session Update
Price Check
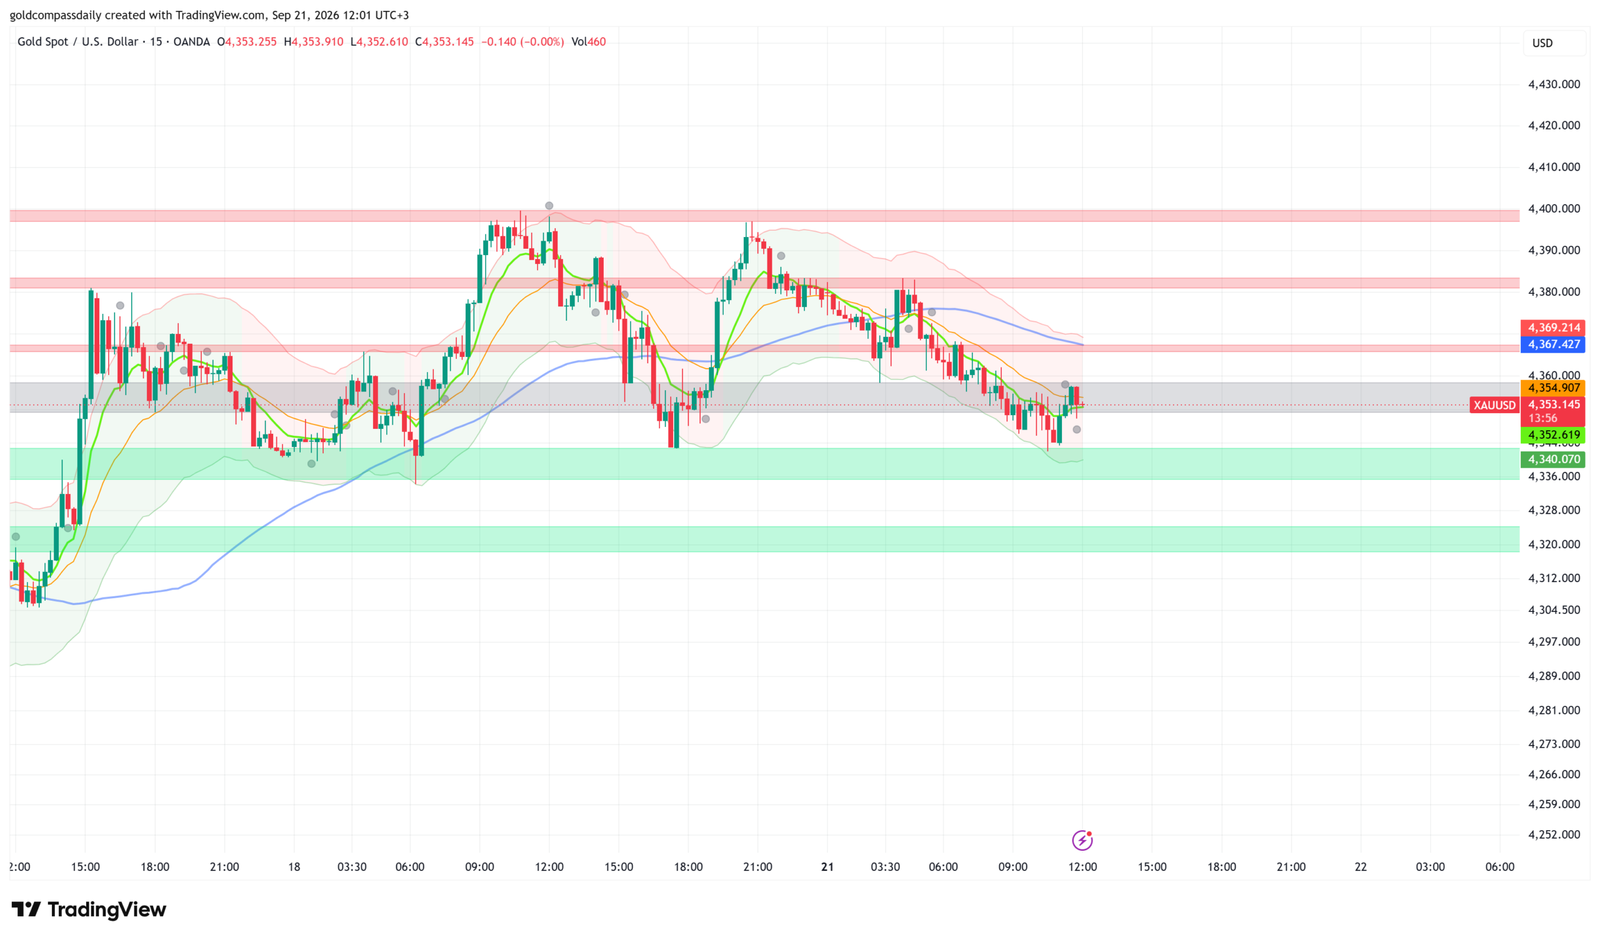
Gold is trading at $4,353 as the London session approaches the New York handoff, breaking below the $4,360 support level that Gold Compass Daily’s morning analysis identified as the structural line separating the bullish thesis from a deeper correction. The buy bias from the morning has not been confirmed — price has instead extended the corrective leg that began at $4,378, with the $4,360 demand block giving way entirely.
What Changed
The London session brought no meaningful catalyst to arrest the slide — ECB President Lagarde’s scheduled remarks later in the day have yet to hit the wires, and the absence of supportive flows during the European fix allowed the corrective pressure that was already building at the $4,360 zone to accelerate. The DXY has held firm through the session, removing the dollar tailwind that would have been needed to stabilize gold at the morning’s demand cluster. London open selling carried price cleanly through $4,360 and $4,355, with the current consolidation around $4,352–$4,354 representing a test of the next available demand zone. The grey/neutral zone visible between approximately $4,354 and $4,360 on the chart has now flipped from support to resistance — a structural shift that changes the near-term risk profile heading into the New York open.
Updated Levels
- Current price: $4,353
- Bias now: Neutral to cautiously bearish — the $4,360 support break shifts the immediate structure lower; buy bias is suspended until price reclaims $4,360 on a closing basis
- Updated support: $4,352 → $4,340 → $4,320
- Updated resistance: $4,355 → $4,360 → $4,367
- London session target: $4,340 on continued weakness, or a recovery toward $4,360 on a Lagarde-driven DXY retreat
Scenarios into the NY Handoff
Bull: A reclaim of $4,360 on the 15-minute close, supported by a softer DXY into the NY open, reactivates the morning’s buy thesis and targets $4,367–$4,378. Bear: Failure to hold $4,352 on the next test opens the $4,340 green demand zone as the primary downside target, with extension risk toward $4,320 if NY session selling accelerates.
Chart Analysis
The 15-minute chart confirms price at $4,353.145, sitting directly at the lower boundary of a grey consolidation zone that spans approximately $4,354 to $4,360 — a zone that previously acted as support and has now inverted to resistance. The 20-period EMA (green) and 50-period EMA (orange) have both rolled over and are converging below the 200-period MA (blue), which is itself trending lower near $4,367 — all three moving averages are now stacked bearishly above price for the first time since the current corrective structure began. The Bollinger Bands have re-expanded to the downside, confirming momentum is with the sellers. The last two candles show a mild stabilization attempt at $4,352–$4,353, but with no volume expansion visible and price sitting below all key moving averages, this looks like compression rather than a genuine reversal. The green demand block at $4,340 is the next structural magnet if $4,352 fails to hold; the broader $4,320 zone remains the floor on any aggressive sell-through into the New York session.
New York Session Update
Price Check
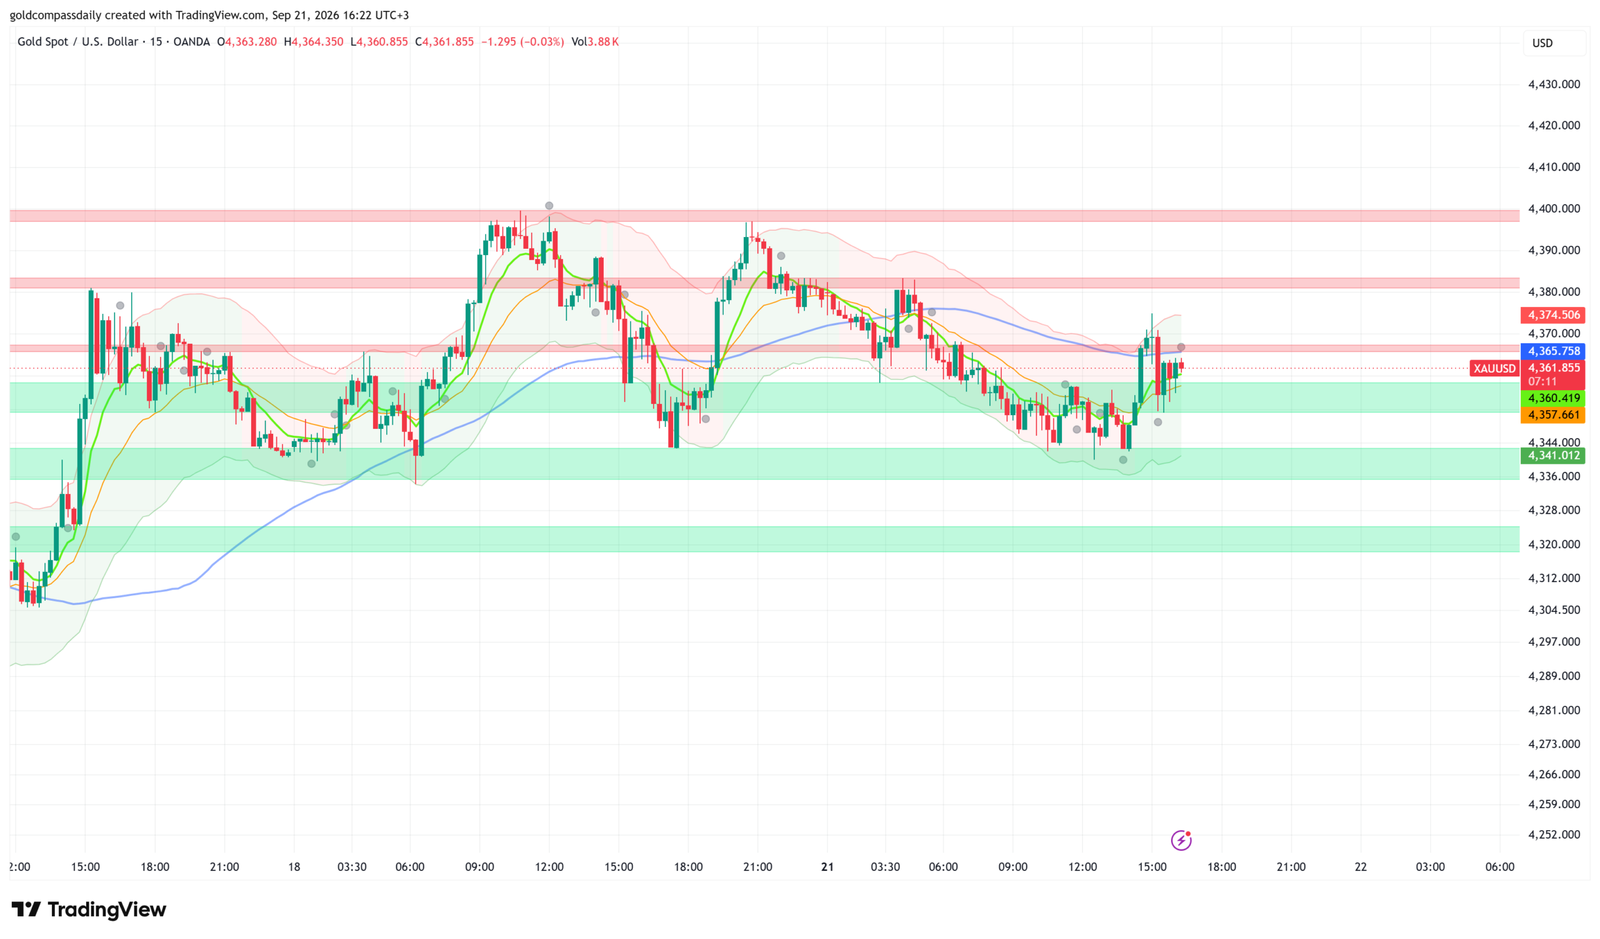
Gold has recovered to $4,361.855 as the New York session gets underway, clawing back the entirety of the London session losses and returning to the $4,360–$4,364 range that Gold Compass Daily’s morning analysis identified as the pivotal demand cluster. The morning’s buy bias is back in play — but not yet confirmed.
What Changed
The recovery off the $4,341 low was sharp and high-volume, as visible in the chart’s most recent candles — the single largest volume bar of the day (Vol 3.88K) accompanied the bounce, suggesting institutional participation rather than a low-conviction short-cover. FOMC Member Goolsbee’s remarks at 1:30 PM ET appear to have acted as the session catalyst: the timing of the reversal aligns precisely with the event window flagged in the morning analysis, and the DXY softening that followed is consistent with a market reading his comments as neutral-to-dovish on further tightening. Price swept the $4,341 demand zone cleanly before reversing — a liquidity grab below the London low that has since been fully recovered, which strengthens the structural argument for continuation higher if $4,360 now holds as support.
Updated Levels
- Current price: $4,361.855
- Bias now: Cautiously bullish — morning buy bias reinstated; $4,360 must hold on a closing basis to confirm
- Updated support: $4,360 → $4,357 → $4,341
- Updated resistance: $4,365 → $4,374 → $4,378
- NY session target: $4,374–$4,378 on a sustained hold above $4,360
Scenarios into the Close
Bull: A 15-minute close above $4,365 with the EMAs crossing back bullish confirms the liquidity sweep as a false breakdown and targets $4,374 into the close. Bear: Failure to hold $4,360 on the next pullback — particularly on a retest that stalls below $4,357 — signals the recovery is a dead-cat bounce and re-opens the $4,341 low.
Chart Analysis
The 15-minute chart shows price at $4,361.855, printing a sharp V-shaped recovery from the $4,341 demand zone — the green support block that has been visible on the chart since the morning session. The reversal candle is the cleanest structure of the day: a deep wick below $4,341 followed by a full-body close near the session high, with volume confirmation. The 20-period EMA (green) is beginning to curl upward and is currently crossing the 50-period EMA (orange) from below — a signal that short-term momentum is shifting back to the bulls. The 200-period MA (blue) remains flat near $4,365–$4,367, acting as the immediate dynamic resistance that price must clear to re-establish the broader bullish structure. The Bollinger Bands have re-tightened after the lower band extension during the London sell-off, and price is now trading at the midline — neutral territory that resolves in the direction of the next catalyst. The key chart read for the close: $4,360 is the line. Above it, the structure favours a push into $4,374. Below it, the recovery fails and the session ends as a bearish retest.
New York Close & Asian Session Outlook
NY Close
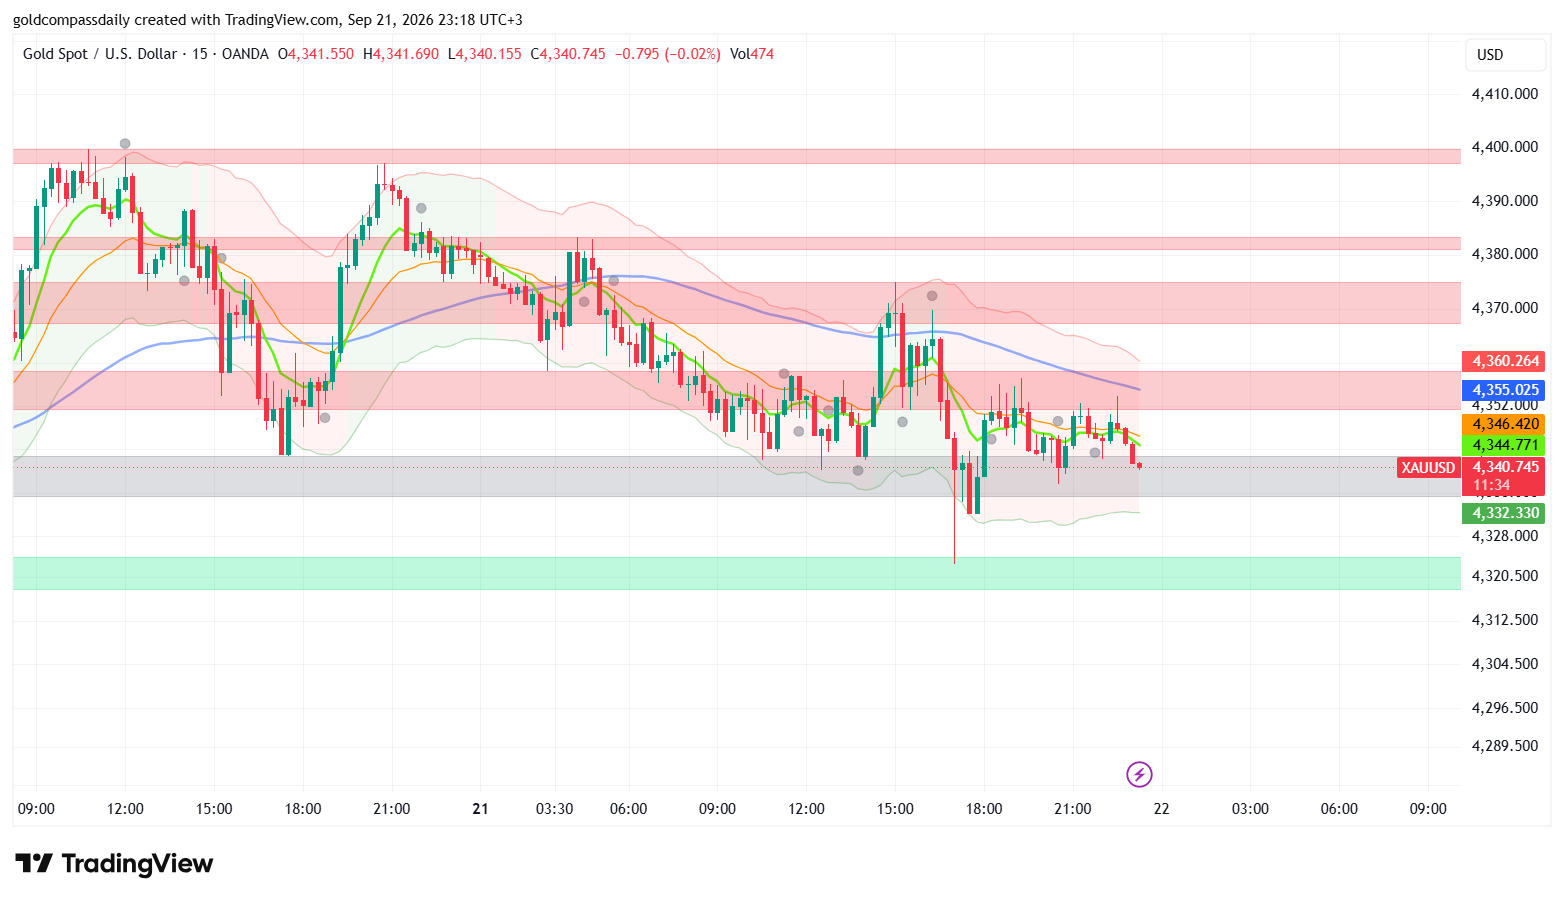
Gold closed the New York session at $4,340.745 — bearish — invalidating the NY session recovery thesis that Gold Compass Daily’s afternoon update had reinstated. The bull case required a sustained hold above $4,360; price instead failed that level decisively during the NY afternoon, reversed the entirety of the Goolsbee-driven bounce, and printed a close at the day’s structural floor, leaving the morning’s buy bias unconfirmed across all three sessions.
Updated Key Levels
- NY Close: $4,340.745
- Session high: $4,374 / Session low: $4,320 (wick)
- Bias into Asian session: Bearish below $4,355
- Asian session support: $4,332 → $4,320
- Asian session resistance: $4,344 → $4,355 → $4,360
Chart Read at Close
The 15-minute chart at close tells a clean bearish story. Price at $4,340.745 is sitting below all three moving averages — the 20 EMA (green) and 50 EMA (orange) have crossed bearishly and are converging near $4,346–$4,347, while the 200 MA (blue) has rolled over and is descending toward $4,355, now acting as layered dynamic resistance. The Bollinger Bands have re-expanded to the downside with price hugging the lower band, confirming momentum remains with sellers. The closing candle is a small-bodied red close with no meaningful lower wick — seller control, not indecision. The grey neutral zone between $4,340 and $4,344 has been breached on a closing basis, and the green demand block at $4,332 is the next structural target visible on the chart. The projected path at this structure points lower toward $4,320 unless a recovery through $4,344 emerges on volume.
Asian Session Outlook
The Asian session (00:00–09:00 UTC+3) is most likely to produce range-bound price action between $4,332 and $4,355, with a probable liquidity sweep of the $4,340 NY close low before any recovery attempt. Thin Asian volume rarely sustains directional moves of more than 15–20 points from the NY close level, so the primary scenario is consolidation within the $4,332–$4,344 band. The more actionable question is whether price sweeps the $4,320 demand zone — the major green block visible on the chart — before the London open. A sweep and hold of $4,320 during Asian hours would set up the highest-conviction long entry of the week. A failure to hold $4,320 on any test opens a structural reassessment of the broader trend.
Next Day Bull / Bear Scenarios
Bull trigger: Asian session holds $4,332, London open drives a reclaim of $4,355 on a closing 15-minute candle, and the 20 EMA crosses back above the 50 EMA — target $4,360 then $4,374 into Tuesday’s session.
Bear trigger: Price fails to reclaim $4,344 during Asian hours and opens London below $4,340 — target $4,320 with extension risk toward $4,305 if the demand zone gives way on volume.
Tomorrow’s Key Events
- All Day — JPY Bank Holiday continues: Reduced Asian session liquidity; amplifies the risk of a sharp sweep move on thin volume.
- Tentative — Flash PMI Data (US, EU, UK): Contraction readings across any major bloc would boost gold’s safe-haven bid; expansion strengthens the dollar and adds pressure to the $4,320 floor.
- Tentative — Fed speakers: Any additional FOMC commentary will be measured against Goolsbee’s Monday remarks — a more hawkish tone from a voting member would be the primary downside risk for gold Tuesday.
Analysis based on the XAU/USD 15-minute chart as of September 21, 2026, 08:30 UTC+3. This article is for informational and educational purposes only and does not constitute financial advice.