

Gold trades cautiously bullish at $4,644 on Wednesday, pulling back from Tuesday’s three-month high near $4,697 as markets hold their breath ahead of the Federal Reserve’s preferred inflation gauge. July Core PCE lands at 12:30 GMT — the single data point most capable of repricing September rate expectations before Fed Chair Kevin Warsh takes the Jackson Hole stage on Friday. The structure remains constructive, but the next directional leg belongs to the data.
Key Levels
- Bias: Bullish above $4,633 — bearish below it
- Support: $4,633 → $4,610
- Resistance: $4,648 → $4,662 → $4,697–$4,700
- Session target: $4,697–$4,700 (conditional on Core PCE ≤ 0.2% m/m or 3.2% y/y)
- Invalidation: Break and close below $4,633 = momentum shift; opens $4,610 test
Catalyst of the Day — July Core PCE (12:30 GMT)
The Bureau of Economic Analysis releases the July Personal Income and Outlays report at 12:30 GMT, delivering Core PCE — the Fed’s primary inflation benchmark — two days ahead of Chair Kevin Warsh’s first Jackson Hole address. Consensus sits at +0.18–0.20% month-on-month and 3.2–3.3% year-on-year, with Polymarket pricing an 88% probability that the annual print lands in that corridor. This data point carries outsized weight because it directly feeds September rate-decision pricing: markets currently assign a 35–40% probability to a hike at the September 15–16 FOMC meeting. A soft print (≤ 0.2% m/m, y/y moving toward 3.2%) would pressure the dollar and clear the path to $4,697–$4,700. A hot print (≥ 0.3% m/m, y/y holding at 3.3% or above) would immediately strengthen the case for a September hike, lift yields, and invite a corrective leg in gold. Watch the first 15 minutes after the 12:30 GMT release for the directional break.
Fundamental Context
Gold’s current recovery from the $3,900 July low is built on three structural pillars: a broadly softer US Dollar, persistent fiscal sustainability concerns, and central bank demand that has shown no sign of abating. Central banks purchased close to 289 tonnes of gold in Q2 2026 — a quarterly record — providing a durable bid underneath each corrective episode. That institutional demand explains why every sharp pullback this month has found buyers before reaching the prior structural lows. The debasement trade — the thesis that dollar-denominated assets lose purchasing power faster than gold over the medium term — gained fresh momentum after the Treasury’s buyback program weakened the dollar in mid-August, sending gold from the mid-$4,300s to the $4,697 high within days.
The macro backdrop for today’s session adds a second layer of complexity. The preliminary Q2 GDP print (also due at 12:30 GMT) will be read alongside PCE for a combined growth-inflation verdict. Strong GDP paired with hot inflation is the most hawkish combination for the Fed and would represent the clearest near-term headwind for gold. Conversely, any sign that growth is softening alongside still-elevated inflation creates a stagflation-adjacent read — a historically supportive environment for bullion as the market questions the Fed’s ability to tighten aggressively without triggering a hard landing. Australia’s July CPI data, released earlier this session at 3.5% year-on-year with trimmed mean at 0.5%, confirms that G10 central banks are still operating in an above-target inflation environment — reinforcing the global context in which gold’s debasement thesis finds traction.
Chart Analysis
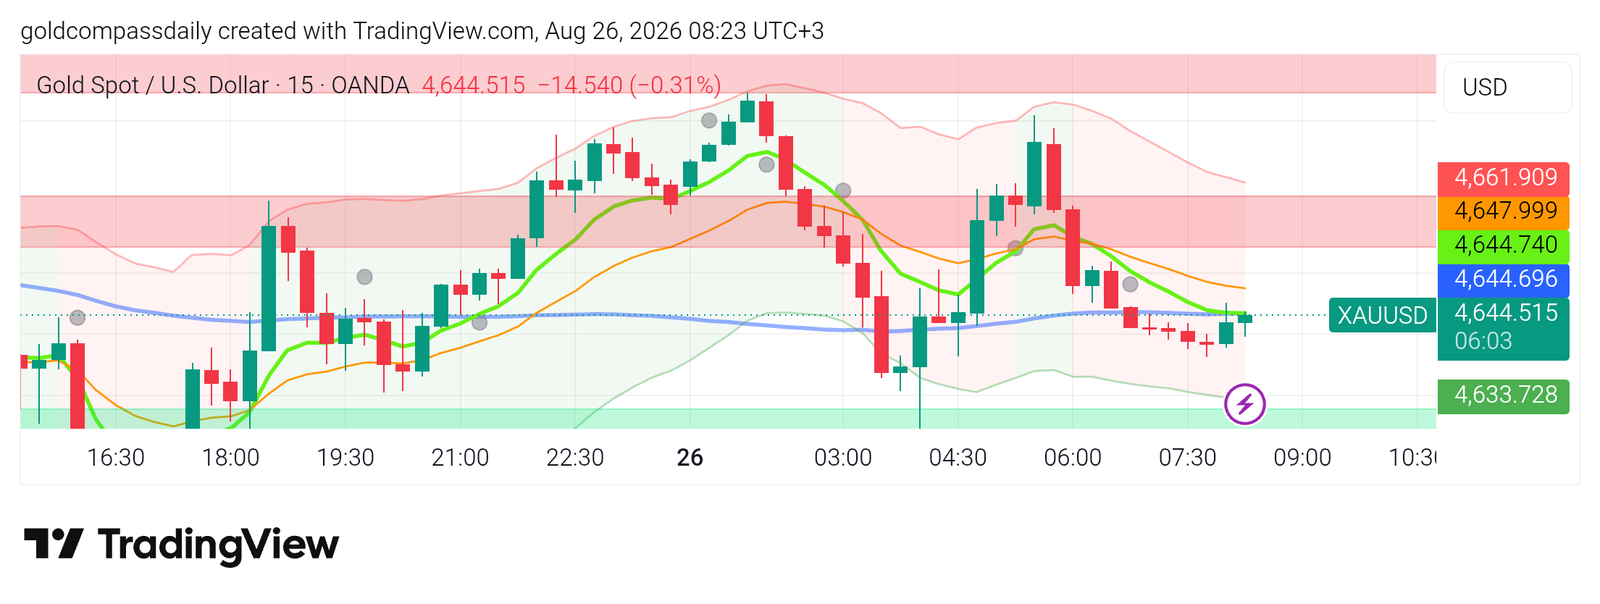
The 15-minute XAU/USD chart (08:23 UTC+3, August 26) shows price trading at $4,644.52 after completing a sharp intraday reversal from the $4,662 resistance zone. The session formed a clear inverted-V structure: a rally from the $4,610 area through the Asian session peaked just below $4,662 before sellers re-engaged, driving a flush toward the $4,633 support band — the green lower boundary visible on the chart. Price has since recovered and is consolidating between $4,633 and $4,648, with the faster green moving average having crossed below the slower orange MA — a short-term bearish signal on the 15-minute timeframe. The blue horizontal reference line near $4,640 represents the session’s VWAP-equivalent anchor, and price is hugging it from above, indicating indecision ahead of the data release. The $4,633 level is confirmed as the key intraday floor; a sustained break below it would indicate distribution rather than consolidation. The $4,661–$4,662 band overhead represents the first supply zone where sellers have already shown their hand twice this session. The broader trend on the daily timeframe remains firmly bullish — price holds above all major simple moving averages, including the 200-day SMA at $4,522 — meaning the 15-minute pullback is corrective in nature, not a trend reversal. The projected path into the New York open is range-bound between $4,633 and $4,662 until PCE resolves direction.
Bull and Bear Scenarios
Bull Trigger
Core PCE prints at or below +0.18% m/m and/or y/y moves toward 3.2% → Dollar selling resumes, gold breaks above $4,662 with momentum → Target: $4,697–$4,700. A clean close above $4,700 on the daily chart would constitute a fresh multi-month breakout and open $4,720 as the next structural target before Friday’s Warsh speech.
Bear Trigger
Core PCE prints at or above +0.3% m/m or y/y holds at 3.3%+ → Rate hike probability for September spikes above 45%, dollar bids, gold breaks below $4,633 → Target: $4,610. A sustained break below $4,610 would shift intraday bias to neutral and expose $4,580–$4,565 as the next demand zone.
Events Ahead
- Wed Aug 26 — 12:30 GMT — Core PCE m/m & y/y (consensus: +0.18–0.20% m/m / 3.2–3.3% y/y): The Fed’s preferred inflation gauge — the primary directional catalyst for gold today. A soft print is dollar-negative and gold-positive; a hot print raises the September hike probability and pressures bullion.
- Wed Aug 26 — 12:30 GMT — Prelim GDP Q2 (consensus: modest growth): Frames the growth-inflation combined read. Strong GDP + hot PCE = most hawkish scenario for gold.
- Wed Aug 26 — 12:30 GMT — Durable Goods Orders m/m: Secondary read on US demand health; a large miss could add dollar weakness and supportive momentum for gold.
- Wed Aug 26 — 19:45 GMT — FOMC Member Barkin Speaks: First Fed official to comment publicly after today’s PCE data — his framing of the print will immediately signal how the committee is interpreting the number relative to the September decision.
- Thu Aug 27 — 12:30 GMT — Initial Jobless Claims: Labour market resilience is the main counterargument to rate cuts; a surprise rise above 240K would revive easing expectations and support gold.
- Fri Aug 28 — Fed Chair Kevin Warsh — Jackson Hole Keynote: The week’s headline event. Warsh’s first major address as chair will be parsed for any structural shift in the Fed’s reaction function. A hawkish framing of the inflation fight risks a sharp gold pullback; any dovish lean or acknowledgment of fiscal pressures would likely fuel a test of $4,720+.
For the full week-ahead context, see the Gold Week Ahead: Aug 24–28 — Jackson Hole Edition. Yesterday’s session analysis is available here: Gold Holds $4,647 as ADP and Fed’s Barkin Test the Bull Case.
New York Session Update
Price Check
Gold Compass Daily’s morning analysis projected a bullish session contingent on Core PCE printing at or below 0.2% month-on-month. The data did not deliver that clearance: gold has since shed $50 from the morning’s $4,644 level and trades at $4,594 as of 21:33 UTC+3 — the bear scenario is in play.
What Changed
The July Personal Income and Outlays report released at 12:30 GMT delivered a mixed-to-hawkish verdict. Core PCE came in at 0.2% month-on-month and 3.3% year-on-year — in line with consensus but offering no downside surprise. Critically, headline PCE held at 3.7% annually, beating the 3.6% forecast, while real consumer spending was flat versus June’s 0.4% gain — a combination the market read as stagflation-adjacent rather than disinflationary. The print did not materially alter September FOMC probabilities, with the CME FedWatch Tool still showing approximately 36–39% odds of a hike, but it eliminated any prospect of a dovish repricing heading into Friday’s Warsh keynote. With no catalyst to push the dollar lower, profit-taking from Tuesday’s three-month high at $4,697 accelerated into the New York afternoon. Preliminary Q2 GDP confirmed growth at the soft end of expectations, adding to the sense that the Fed is navigating a deteriorating growth-inflation trade-off — which kept the decline from becoming a full rout but provided no fresh bullish impulse for gold.
Updated Levels
- Current price: $4,594
- Bias now: Shifted to bearish intraday — the morning’s $4,633 invalidation level was breached and held as resistance on the subsequent bounce attempt
- Updated support: $4,583 → $4,565
- Updated resistance: $4,601 → $4,619 → $4,633
- NY session target: $4,583 (on continued dollar strength); a hold above $4,583 opens a technical consolidation into the close
Scenarios Into the Close
Bull: Price reclaims and closes above $4,601 on the 15-minute chart with volume → short-covering bounce targets $4,619, with $4,633 as the ceiling before Friday’s Warsh speech. Bear: Failure to hold $4,583 on a closing basis → downside extends toward $4,565, with a risk of testing the $4,540–$4,545 demand zone if Barkin’s 19:45 GMT remarks carry a hawkish tilt.
Chart Analysis
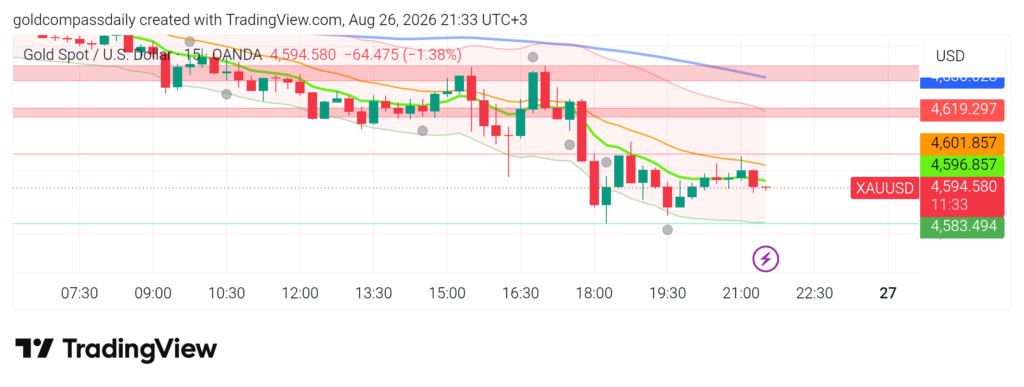
The 15-minute chart (21:33 UTC+3, August 26) shows a sustained, orderly downtrend from the session open near $4,619 — the upper red resistance band visible on the chart — all the way to the current $4,594. Both the faster green moving average and the slower orange MA have rolled decisively lower and are now stacked in bearish sequence, with price trading below both. A brief recovery attempt around the 16:30–17:00 UTC+3 window reached the orange MA from below and was immediately rejected — a textbook failed retest that confirmed the resistance-flip dynamic. The green lower support band at $4,583 has not yet been tested on a closing basis; the single wick that pierced it around 19:00 UTC+3 recovered quickly, suggesting a degree of residual demand at that level. The dotted session reference line near $4,590 represents the area where price is currently compressing, consistent with late-session indecision ahead of tomorrow’s Initial Jobless Claims. The blue MA at the far right of the chart has flattened near $4,593–$4,596 and is acting as a near-term magnet. Unless Barkin delivers a surprise at 19:45 GMT, price is likely to oscillate between $4,583 and $4,601 through the cash close, with the broader directional verdict deferred to Friday’s Warsh keynote at Jackson Hole.
New York Close & Asian Session Outlook
NY Close
Gold closed the New York session at approximately $4,591 — bearish — confirming the bear scenario outlined in Gold Compass Daily’s morning analysis, which flagged a break below $4,633 as a momentum shift targeting $4,610 and ultimately $4,583. Price never reclaimed the $4,601 resistance level required to neutralise intraday selling pressure, and the session ended with gold down roughly $53 from the morning’s $4,644 level, printing its weakest close since August 22.
Updated Key Levels
- NY Close: $4,591
- Session high: $4,670 / Session low: $4,581
- Bias into Asian session: Cautiously neutral — range-bound above $4,581
- Asian session support: $4,581 → $4,565
- Asian session resistance: $4,597 → $4,612 → $4,623
Chart Read at Close
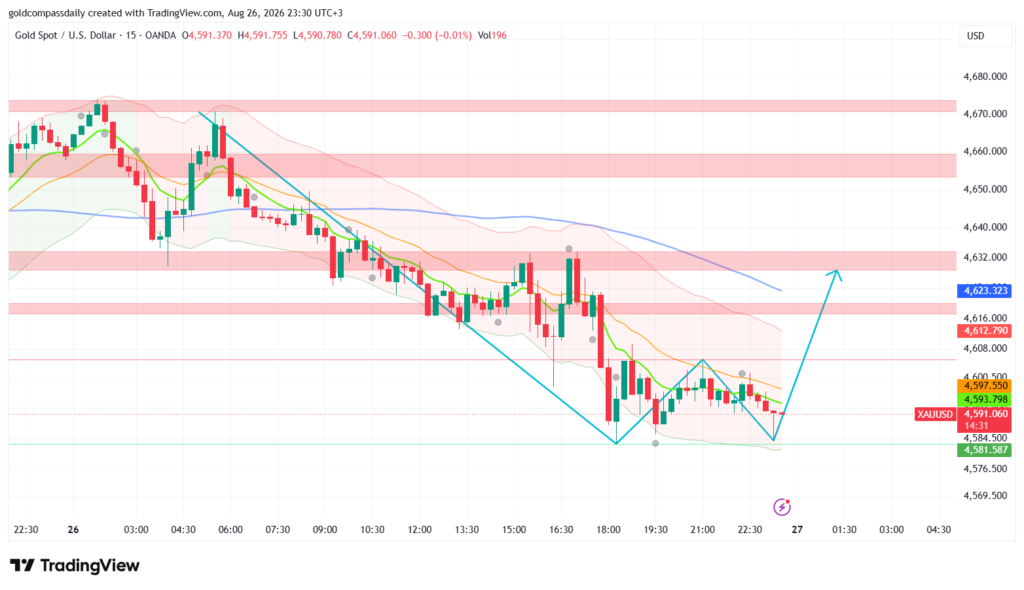
The 15-minute chart at 23:30 UTC+3 shows price compressing tightly between the green demand floor at $4,581 and the orange moving average descending from above near $4,597. Both the green and orange MAs remain in bearish sequence — stacked above price — while the Bollinger Bands have narrowed sharply at the right edge of the chart, signalling volatility compression ahead of the Asian open. The projected path arrow drawn on the chart confirms the editorial read: a final dip toward or marginally below $4,581 to complete a liquidity sweep of the NY session low, followed by a recovery attempt toward $4,612–$4,623. Closing candle structure is indecisive — small-bodied doji-type prints with equal upper and lower wicks — consistent with neither buyer nor seller conviction at this level. The blue MA has curved down through $4,623, now acting as overhead resistance and capping any recovery that does not carry genuine volume.
Asian Session Outlook
The Asian session (00:00–09:00 UTC+3) is most likely to open with a low-liquidity range between $4,581 and $4,601. The chart’s projected path suggests a probable liquidity sweep of the $4,581 NY low during the Tokyo open window — a common structure after a sustained trending session — before price attempts to recover toward the $4,612–$4,623 resistance band ahead of the London open. A clean sweep and rejection of $4,581 without a daily close below it would preserve the broader weekly bullish structure and set up a more constructive entry ahead of Thursday’s Initial Jobless Claims. Failure to hold $4,581 on a closing basis shifts the Asian session bias to outright bearish and opens $4,565 as the next meaningful demand zone.
Next Day Bull / Bear Scenarios
- Bull trigger: Asian session holds $4,581, London open reclaims $4,612 with momentum → target $4,632–$4,640 ahead of Jobless Claims; a strong claims beat extends toward $4,660
- Bear trigger: Sustained break and close below $4,581 in Asian or early London session → target $4,565, with risk of $4,540–$4,545 if Thursday’s claims disappoint and Friday’s Warsh tone turns hawkish
Tomorrow’s Key Events
- 15:30 UTC+3 — US Initial Jobless Claims (forecast: ~230K): The primary Thursday catalyst for gold — a print above 240K revives Fed hold expectations and supports a recovery bid; below 220K reinforces the labour market resilience narrative and keeps September hike odds elevated
- 15:30 UTC+3 — US Preliminary GDP Q2 Revisions: Second look at growth; any downward revision to the 1.5% advance estimate adds stagflation weight and is structurally gold-positive
- All day — Jackson Hole Symposium (Day 2): Secondary Fed speakers set the table ahead of Chair Warsh’s Friday keynote — any on-record September hike signal moves gold immediately
Analysis based on the XAU/USD 15-minute chart as of August 26, 2026, 08:23 UTC+3. This article is for informational and educational purposes only and does not constitute financial advice.