

Headline Thesis
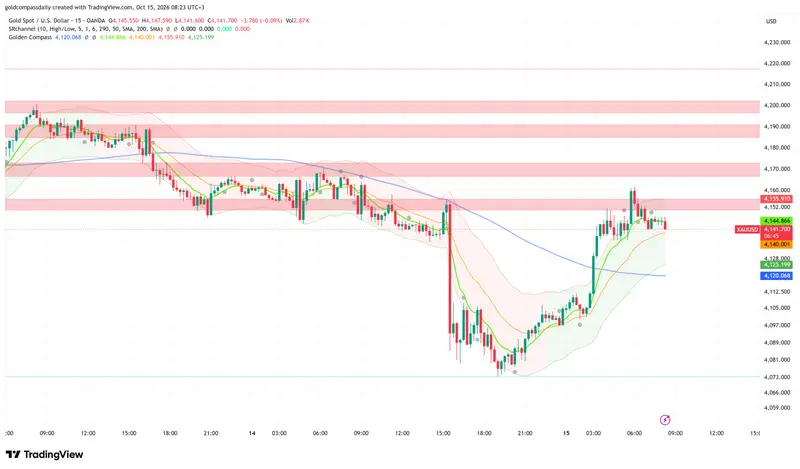
Gold trades cautiously bullish at $4,142 — the V-shaped recovery from Wednesday’s $4,073 low has reclaimed the 200-period moving average, and the US Retail Sales and PPI releases at 15:30 will decide whether the $4,152–$4,156 ceiling breaks. The bias stays positive while price holds above $4,120. Gold Compass Daily reports that the recovery is intact, but the structure is not yet confirmed. Buyers still need a clean break of resistance.
Key Levels
- Bias: Cautiously Bullish above $4,120
- Support: $4,140 → $4,125 → $4,120
- Resistance: $4,156 → $4,170 → $4,190
- Session target: $4,170 (conditional on softer-than-expected US Retail Sales)
- Invalidation: Below $4,120 = recovery structure fails and the $4,073 low comes back into play
Catalyst of the Day
The US Retail Sales and PPI releases at 15:30 (UTC+3) are the priority for gold today. Retail Sales is forecast at 0.3% m/m after a 1.2% surge, and Core Retail Sales at 0.6% after 1.4%. Headline PPI is expected at 0.6% (previous 0.4%) and Core PPI at 0.3% (previous 0.2%). Consumer spending feeds directly into rate expectations, so a cooling retail print would pressure Treasury yields and the dollar, which favors gold. A hot PPI reading would do the opposite by reviving pricing-pressure concerns. At 15:30, watch whether Retail Sales undershoots the 0.3% forecast and Core PPI stays at or below 0.3%. That combination is the cleanest path to a break above $4,156.
Fundamental Context
The overnight data was mixed and had limited direct impact on gold. Australian employment fell 39.3K against a forecast of 19.6K gain, with unemployment at 4.7%. That weakens the Australian dollar and adds marginal support to the US dollar, a mild headwind for gold. Japan’s core machinery orders beat at 5.2% against a 2.2% forecast but did not move the metal.
The next window opens at 09:00 with UK GDP, forecast at -0.1% m/m after 0.4%, alongside industrial and manufacturing production. A weak UK print would pressure sterling and could give the dollar a brief lift, which matters for gold only if it pushes price back below $4,140. Bank of England Governor Bailey (10:30) and MPC member Breeden (11:45) follow, and hawkish commentary would support the pound against the dollar, a mild tailwind for gold.
The afternoon is dominated by US data. Beyond Retail Sales and PPI, the Philly Fed Manufacturing Index is forecast at 28.2 (previous 37.8) and the Empire State Index at 12.1 (previous 7.6). Unemployment Claims are expected at 199K, close to the previous 197K. A cooling Philly Fed with stable claims supports a softer-growth narrative that favors gold. A strong claims drop would reinforce labor-market resilience and cap the rally.
Chart Analysis
On the 15-minute chart, gold trades at $4,141.70, up from Wednesday’s low near $4,073, which printed late in the session after a sharp impulse lower at 15:30 local time. The recovery built through the European session and accelerated around 03:00, when a strong impulse candle reclaimed the 200-period SMA at $4,120. Price then tested the $4,152–$4,156 resistance band and was rejected at about $4,161 near 06:00, leaving a long upper wick. Since then price has consolidated in a $4,140–$4,152 range with lower highs, and the current candle sits just below the fast moving average at $4,144.87 and just above the secondary average at $4,140.00. That points to fading short-term momentum but no breakdown. The lower channel boundary at $4,125 and the 200 SMA at $4,120 form the support cluster. The 03:00 impulse also left a thin-trade zone between $4,105 and $4,125, so a pullback into it is possible without damaging the structure. Overhead, the $4,166–$4,173, $4,185–$4,191 and $4,196–$4,202 bands remain intact as resistance. The chart confirms the supplied levels and shows an intraday high of $4,161 rather than a recovery capped at $4,144. The projected path is a continued $4,140–$4,156 range into 15:30, followed by a directional break on the data.
Bull / Bear Scenarios
- Bull trigger: A 15-minute close above $4,156 after Retail Sales comes in below 0.3% and Core PPI at or below 0.3% → $4,170 first, then $4,190 if momentum holds.
- Bear trigger: A 15-minute close below $4,125, followed by a break of $4,120, after hot PPI or a Retail Sales beat → $4,105, then $4,097 and the $4,073 low.
Events Ahead
- Thu 09:00 — UK GDP m/m (-0.1%): a weak print pressures sterling and can lift the dollar briefly, testing gold’s $4,140 support.
- Thu 10:30 — BoE Governor Bailey speaks: hawkish tone supports sterling and eases dollar pressure on gold.
- Thu 15:30 — US Retail Sales (0.3%), Core Retail Sales (0.6%), PPI (0.6%), Core PPI (0.3%), Philly Fed (28.2), Empire State (12.1), Unemployment Claims (199K): the session’s main driver for yields, the dollar and gold.
- Thu 17:30 — US Natural Gas Storage (76B): minor for gold, relevant only through broader risk sentiment.
- Thu 19:00 — US Crude Oil Inventories (0.2M): an oil-driven inflation signal that can nudge rate expectations.
- Thu 23:30 — FOMC member Hammack speaks: late hawkish or dovish guidance can shift overnight positioning in gold.
For context, read the weekly outlook on how US CPI tests $4,200 resistance and yesterday’s XAU/USD analysis at $4,150.
Gold Compass Daily’s plan: hold the buy bias above $4,120 and look to add on dips toward $4,125–$4,140 only if US data does not surprise hawkishly. The next step up is a confirmed 15-minute close above $4,156, and a close below $4,120 cancels it.
New York Session Update
Price check: Gold trades at $4,157.52, above the $4,156 level that capped the morning rally, so the cautiously bullish bias has held. Gold Compass Daily’s morning analysis flagged $4,156 as the break that opens $4,170, and price has since probed $4,169.
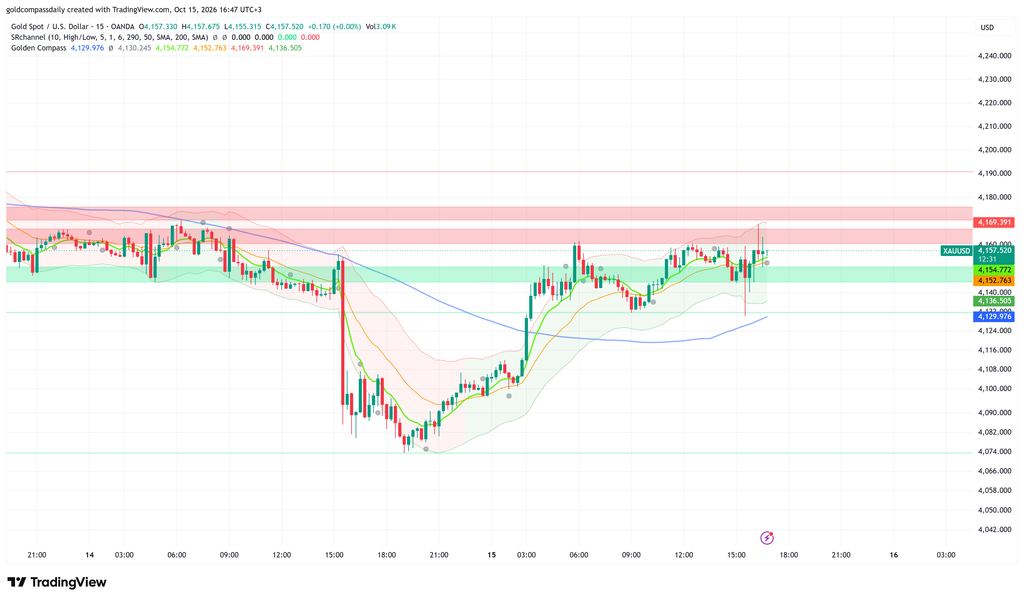
What changed: The 15:30 US data window produced a two-way spike. Gold dipped to about $4,131 on the release, then reversed and ran to about $4,169 within the hour. The dip was bought quickly and never threatened the $4,120 invalidation level from the morning. Since the New York open, price has settled into a narrow $4,155–$4,158 range, which suggests the market is digesting the move rather than extending it. The former resistance zone at $4,152–$4,156 now acts as support.
Updated Levels
- Current price: $4,157.52
- Bias now: Same (cautiously bullish), because price holds above the former resistance and the data-driven dip was fully recovered
- Updated support: $4,152 → $4,145 → $4,136 (lower channel) → $4,130 (200 SMA)
- Updated resistance: $4,166 → $4,170–$4,175 → $4,190
- NY session target: $4,170 (conditional on a 15-minute close above $4,166)
Scenarios Into the Close
Bull: a 15-minute close above $4,166 → $4,175, then $4,190. Bear: a 15-minute close below $4,145 → $4,136, then the 200 SMA at $4,130.
Chart Analysis
On the 15-minute chart, gold trades at $4,157.52, up from Wednesday’s $4,073 low, and the recovery structure is intact. Price sits above both fast moving averages, at $4,154.77 and $4,152.76, with the 200 SMA now rising at $4,129.98, roughly $10 above where it stood in the morning. The averages are stacked bullishly and tightly bunched, which fits the current consolidation. The shaded support zone at $4,144–$4,150 absorbed the 15:30 dip, and the long lower wick near $4,131 shows aggressive dip buying. Overhead, price has repeatedly tested the $4,160–$4,166 band. The $4,169 spike left a long upper wick, so sellers are active there. A second resistance band sits at $4,170–$4,175, and the next major line is at $4,190. The chart confirms the morning levels, with the 200 SMA and the channel floor now shifted higher to $4,130 and $4,136. The projected path is continued consolidation between $4,152 and $4,166 into the close, with a break above $4,166 needed to open $4,170–$4,175.
Analysis based on the XAU/USD 15-minute chart as of October 15, 2026, 08:23 (UTC+3). This article is for informational and educational purposes only and does not constitute financial advice.