Gold Holds $4,003 Below 200 SMA Ahead of US Durables
T. S. Gospodinov
Tue, October 27, 2026 at 6:31 AM • 6 min read
Headline Thesis
Gold trades neutral at $4,003 — a short-term pullback from the $4,024 resistance zone has pushed price below every key moving average, leaving the $3,997 support as the line that decides the session. Gold Compass Daily reports a buy-the-dip bias while $3,997 holds. A decisive break below it would shift the intraday bias to bearish. Yesterday’s analysis flagged the same pivot, with the market defending the 200 SMA near $4,006.
Key Levels
- Bias: Neutral, with a buy-the-dip tilt above $3,997 and bearish below it
- Support: $3,997 → $3,989 → $3,978
- Resistance: $4,011 → $4,014 → $4,024
- Session target: $4,024 (conditional on softer-than-expected US Durable Goods Orders)
- Invalidation: Below $3,987 = the demand zone has failed and the pullback extends toward $3,978
Catalyst of the Day: US Durable Goods Orders
US Durable Goods Orders are the priority for gold today. The headline figure is forecast at +2.0% m/m after -0.1% previously, and the core reading is forecast at +0.6% versus +0.2%. Gold is highly sensitive to US growth surprises right now because strong orders lift the dollar and Treasury yields, which raises the opportunity cost of holding a non-yielding asset. A miss would weaken the dollar and give gold room to reclaim the $4,011–$4,014 band. The release is due at 14:30 (UTC+2). Watch the core figure first, since it strips out volatile aircraft orders. A print at or below +0.2% would favor buyers, while a reading above +0.6% would likely test $3,997.
Fundamental Context
Overnight Asian and European data pointed to sticky inflation abroad. Japan’s BOJ Core CPI printed 2.4% y/y against a 1.9% forecast and 1.8% previously, a sizeable upside surprise. That supports expectations of tighter Japanese policy and a firmer yen. A firmer yen tends to pressure the dollar, which is mildly supportive for gold, although the move has not yet shown up in XAU/USD. UK BRC Shop Price Index also beat at 2.1% y/y against 1.6% expected, which reinforces the view that global disinflation is uneven.
The US session carries the more direct risk. After Durable Goods, ADP Weekly Employment Change (14:15, previous 18.5K) offers a real-time read on labor demand. Weak hiring would lower rate expectations and support gold. At 16:00, CB Consumer Confidence is forecast at 81.2 versus 81.9 previously, and New Home Sales at 651K versus 684K. Both are expected to soften. A confirmed slowdown in household sentiment and housing would add to the case for lower yields, which is the main channel through which gold holds its range.
Chart Analysis
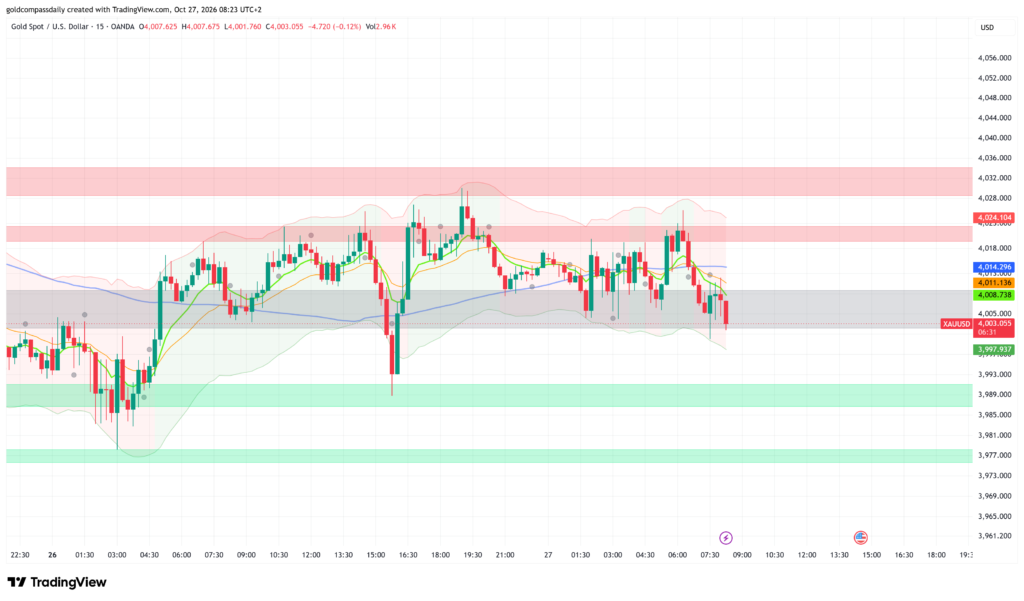
On the 15-minute chart, gold is in a short-term downtrend after failing at the $4,020–$4,024 resistance zone around 06:00. Price is at $4,003, below the fast moving average ($4,008.7), the medium one ($4,011.1) and the slow 200-period line ($4,014.3). That is a bearish stack, with each average acting as dynamic resistance. The lower Bollinger band at $3,997.9 coincides with the support level identified for today. The 07:30 wick into $3,999 was bought quickly, which shows demand near the band. The market has traded a defined range of roughly $3,988–$4,030 over the past 24 hours, and the lower green demand zone at $3,987–$3,991 contains yesterday’s low. The upper red zone at $4,029–$4,034 capped Monday’s high. The chart confirms the levels provided: resistance at $4,024, a test of support near $4,005 (now broken intraday) and the next support at $3,997. The projected path is a probe of $3,997 into the US data. A hold there favors a bounce back to $4,011–$4,014, while a close below it opens $3,989.
Bull / Bear Scenarios
Bull trigger: A hold above $3,997 into 14:30, followed by a soft Durable Goods print and a 15-minute close above $4,014 → targets $4,024, with $4,030 as the extension.
Bear trigger: A 15-minute close below $3,997 on a strong core Durable Goods reading → targets $3,989, then the $3,987–$3,991 demand zone. A break below $3,987 exposes $3,978.
Events Ahead
- Tue 14:15 — ADP Weekly Employment Change (prev. 18.5K): a weak figure would support gold through lower rate expectations.
- Tue 14:30 — Core Durable Goods Orders m/m (+0.6%) and Durable Goods Orders m/m (+2.0%): the key catalyst, as a beat strengthens the dollar and pressures gold.
- Tue 15:00 — S&P/CS Composite-20 HPI y/y (+2.6%) and HPI m/m (+0.2%): housing data feeds into the rate-path debate.
- Tue 16:00 — CB Consumer Confidence (81.2): a miss would add to the growth-slowdown case that supports gold.
- Tue 16:00 — New Home Sales (651K): a weak print would reinforce falling yield expectations.
- Tue 16:00 — Richmond Manufacturing Index (0): a regional read on factory activity.
- Tue 22:30 — API Weekly Statistical Bulletin: a minor energy-driven input for inflation expectations.
The actionable setup is clear: buyers should look for confirmation above $3,997 into the 14:30 release, while a 15-minute close below that level argues for standing aside until $3,989 is tested.
New York Session Update
Gold trades at $4,036, above the $4,024 session target set in Gold Compass Daily’s morning analysis. The morning’s neutral bias with a buy-the-dip tilt held: the intraday low printed in the $3,987–$3,991 demand zone, and the $3,987 invalidation level was never breached.
What Changed
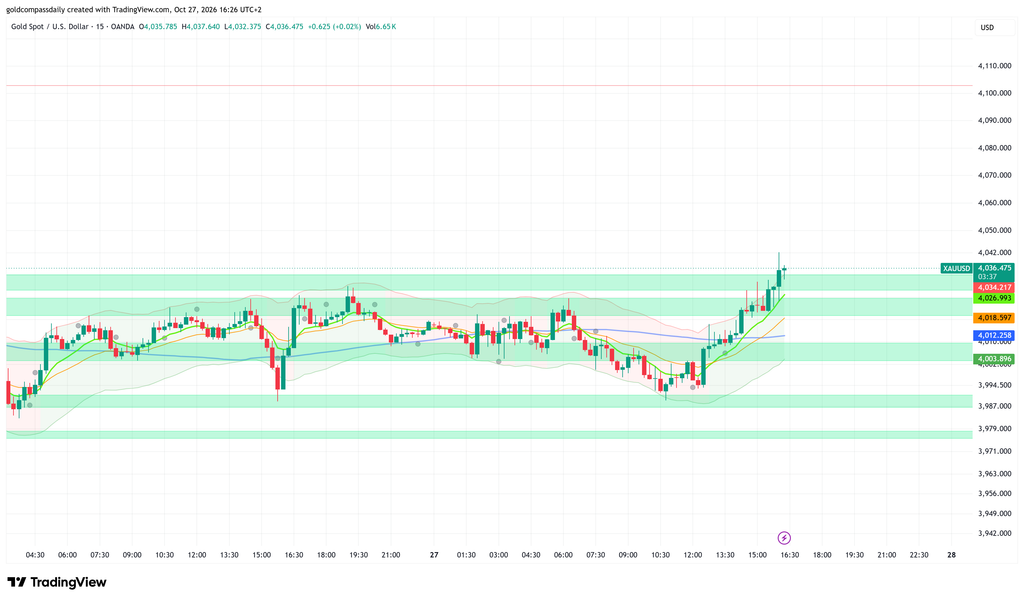
The morning analysis projected a probe of $3,997 followed by a recovery toward the $4,011–$4,014 band if support held. Gold went well beyond that. After defending the demand zone around the midday low, buyers took control and cleared $4,018, $4,026 and $4,034 in succession during the New York session. The short-term trend has shifted from a bearish moving-average stack to a clear bullish structure, and price now trades at its highest levels of the session. The move confirms that dip-buying near $3,990 was the correct reading of the morning setup.
Updated Levels
- Current price: $4,036
- Bias now: Changed from neutral to bullish. Price has reclaimed every moving average and broken the morning resistance zone.
- Updated support: $4,034 → $4,027 → $4,019
- Updated resistance: $4,042 → $4,050 → $4,103
- NY session target: $4,042 (session high), with $4,050 as the extension
Scenarios Into the Close
Bull: A sustained hold above $4,034 and a 15-minute close above $4,042 → $4,050, with $4,103 as the next major reference. Bear: A 15-minute close below $4,027 signals a failed breakout → $4,019, then $4,012.
Chart Analysis
On the 15-minute chart, gold is in a short-term uptrend, having advanced from the $3,989 low to a session high near $4,042. Price sits above all three moving averages, which are now stacked bullishly: the fast average at $4,027, the medium at $4,019 and the 200-period line at $4,012. The averages are turning higher and widening, a sign of accelerating momentum. The green demand zones at $4,028–$4,034 and $4,019–$4,025 have flipped from resistance into support, and the $4,003–$4,009 zone now sits as deeper structural support. Price is trading just above the upper Bollinger band at $4,034, which points to a stretched move. The band has opened upward, so a pullback toward the $4,027–$4,034 breakout zone would be a retest rather than a reversal. The long upper wick at $4,042 shows sellers active at the highs, making that level the first test for continuation. The chart projects a possible pullback to $4,027–$4,034 followed by another attempt at $4,042. The chart confirms the bullish shift; the previous resistance levels of $4,018, $4,026 and $4,034 now act as a support ladder.
Analysis based on the XAU/USD 15-minute chart as of October 27, 2026, 08:23 UTC+2. This article is for informational and educational purposes only and does not constitute financial advice.
Economic Calendar
Disclaimer
The content on Gold Compass Daily is provided for educational and informational purposes only. It does not constitute financial, investment, tax, or legal advice.