
The global financial markets are waking up to a seismic shift in the precious metals sector. This comprehensive Gold price trend analysis examines the multi-timeframe collapse of XAU/USD, which has sent shockwaves through the trading community. After peaking at a staggering $5,600, gold has entered a parabolic decline, challenging long-term support levels and forcing a complete re-evaluation of the bullish thesis for 2026.
Multi-Timeframe Perspective: The Magnitude of the Move
To understand the current state of the market, our Gold price trend analysis looks at the confluence between the 4-hour, 1-hour, and 5-minute charts. On the 4H timeframe, the rejection at $5,600 was definitive. The price action formed a massive “blow-off top,” followed by a series of high-volume red candles that didn’t stop until they reached the $4,600 handle. This move has effectively shifted the medium-term structure from “Extreme Bullish” to “Aggressive Bearish.”
On the 1-hour chart, the carnage is even more detailed. The “Gold Channel Scalper 99” indicator shows that the price has been riding the lower volatility bands for the better part of the last 12 hours. Every minor attempt at a “dead cat bounce” was met with heavy sell orders, creating a staircase pattern to the downside. The $5,000 psychological mark, which many hoped would provide support, was breached with almost no resistance, confirming the lack of buyers in the current environment.
The 5-Minute Micro-View: Scalping in a Hurricane
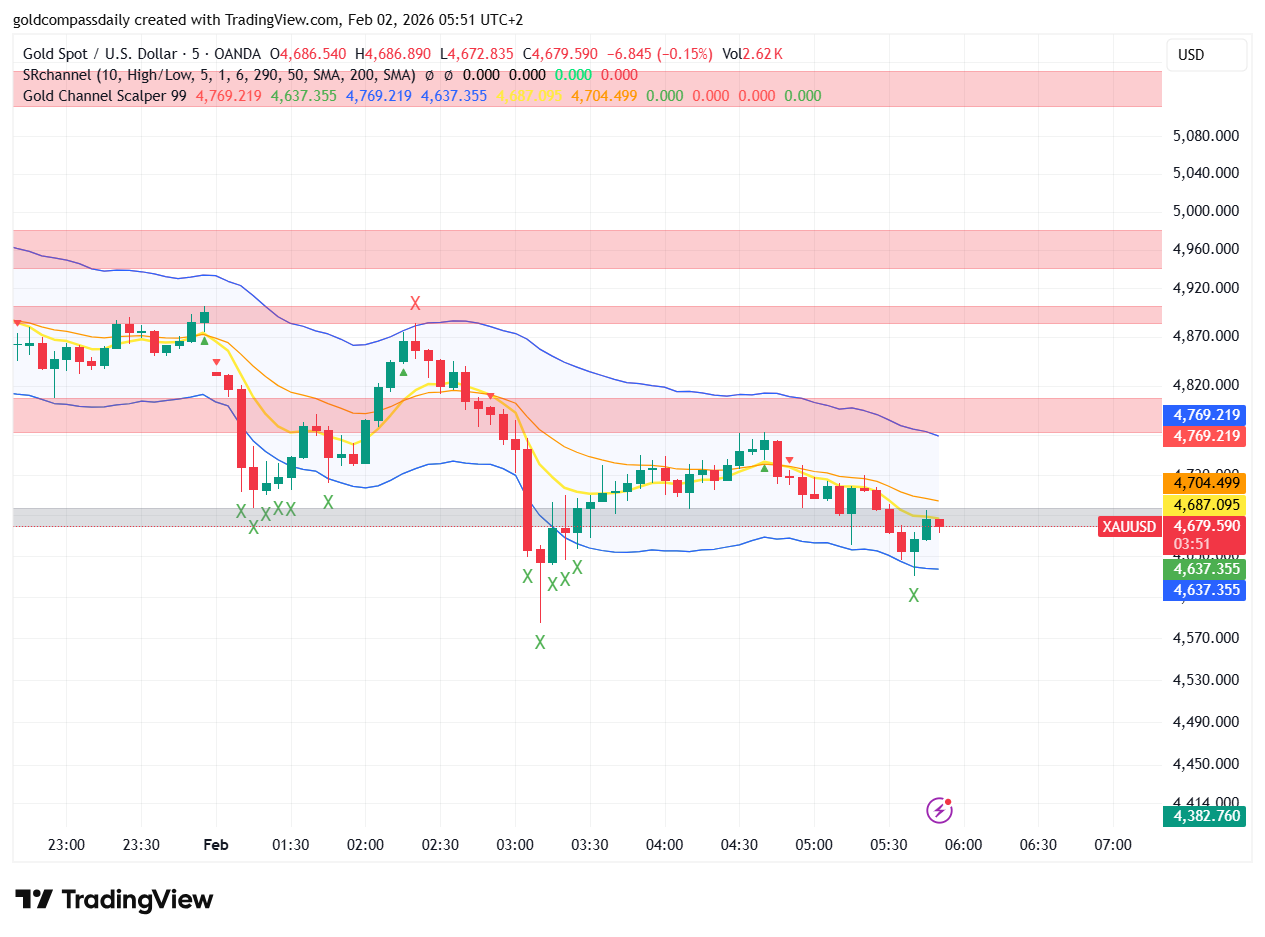
For those engaged in intraday trading, the 5-minute chart provides a granular look at the current panic. Our Gold price trend analysis identifies that volatility has reached levels where standard risk management parameters are being tested to their limits. At the 5M level, the price is currently oscillating around $4,679, attempting to build a temporary floor.
The “X” signals from our proprietary scalping tool are clustered at the $4,730 and $4,820 levels, indicating that short-term supply remains dominant. Even as the RSI on the lower timeframes hits oversold conditions, the price continues to sag, highlighting that momentum is currently a much stronger force than mean reversion. Scalpers should be wary of “wick-outs” as the market hunts for liquidity beneath the $4,630 lows.


Technical Levels: Support and Resistance Zones
As part of this Gold price trend analysis, we have identified the critical price points that will define the next 24 to 48 hours for XAU/USD:
- Major Resistance ($4,807 – $5,135): This broad zone represents the previous consolidation area before the final leg of the crash. It is now a formidable ceiling.
- Immediate Support ($4,637): The current local bottom. If this level fails on a 1H closing basis, the next target is the $4,560 liquidity pool.
- Extreme Value Zone ($4,337 – $4,382): Identified on the 4H chart, this area represents the ultimate “buy the dip” zone where historical institutional interest is expected to reside.
Why the Trend Shifted: Sentiment and Fundamentals
The Gold price trend analysis must also account for the “why” behind the move. The surge in the US Dollar Index (DXY) and a sudden hawkish pivot in global yield expectations have stripped gold of its safe-haven premium. As investors dash for cash, the liquidation of gold positions has become a source of liquidity for other margin-strained assets. This is not a slow decline; it is a structural deleveraging event.
Volume analysis across all timeframes confirms the severity. The 4H volume of over 209K lots indicates that this is not a retail-driven panic, but a professional exit. Until we see a sustained period of “flat” price action accompanied by declining sell volume, any rally should be viewed as a corrective move within a primary downtrend.
Conclusion: Navigating the New Reality
In summary, our Gold price trend analysis suggests that the era of $5,000 gold has faced a brutal reality check. The technical damage is extensive, and recovery will likely take time. Traders should pivot their strategies from “buy-the-dip” to “sell-the-rally” until a confirmed structural bottom is formed on the daily and 4H charts.
For further details on specific timeframe setups, you can explore our dedicated deep-dives:
- 5M Scalping Strategy and Micro-Levels
- 1H Intraday Prediction and Momentum
- 4H Macro Crash Analysis and Supply Zones
Stay disciplined, manage your leverage, and let the charts guide your decisions. The market doesn’t care about opinions, only price action—and right now, price action is shouting “caution.”