
As of February 20, 2026, Gold (XAU/USD) is demonstrating remarkable technical precision by utilizing the 0.5 Fibonacci retracement level as a foundational support zone. Following the volatile swings seen earlier this month, this “halfway back” mark has emerged as the primary psychological and structural floor where buyers are actively re-entering the market.
0.5 Fibonacci Support: The Pivot to Stability
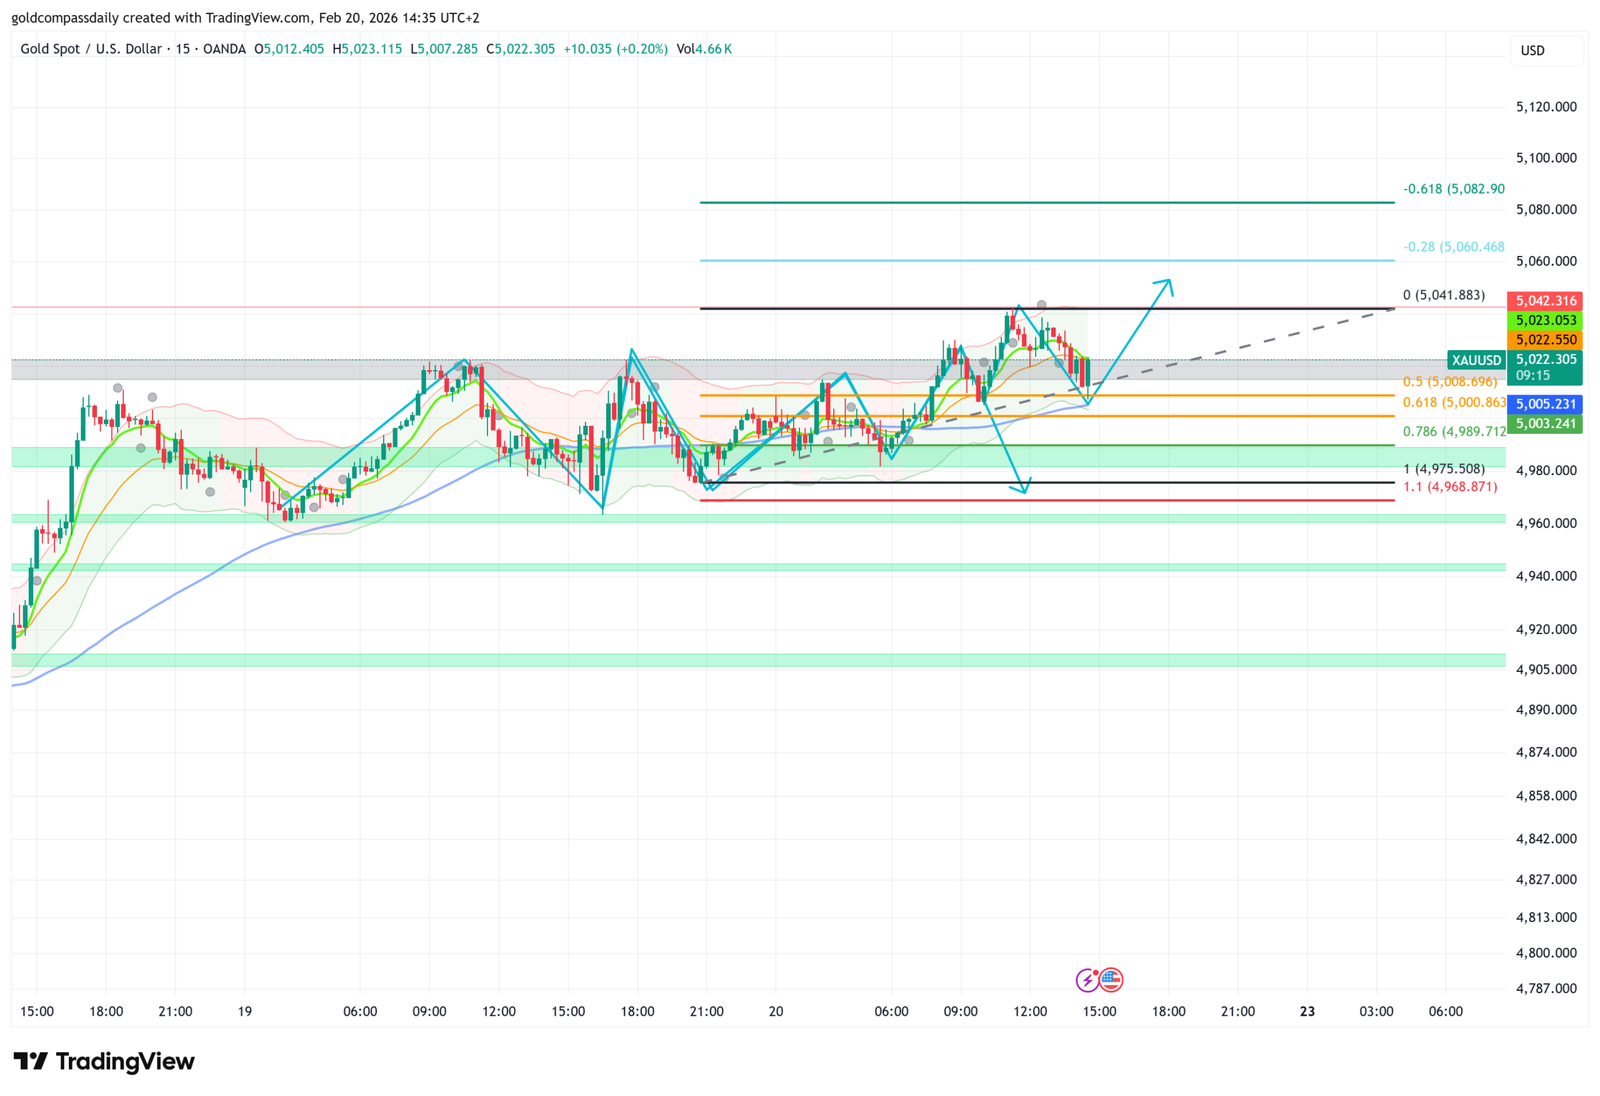
The 0.5 Fibonacci level, situated at $4,999.94 (measured from the January high of $5,597.89 to the February low of $4,401.99), is currently acting as a critical magnetic pivot. By holding above this $5,000 threshold, Gold has effectively neutralized the immediate bearish pressure from earlier in the week. This reaction confirms that the current phase is a healthy technical consolidation rather than a trend reversal.
- Buy-Side Liquidity: Consistent price rejection at the $4,990–$5,000 zone suggests strong institutional demand at these levels ahead of key US economic data.
- Moving Average Confluence: The price is currently oscillating around the 21-day SMA ($5,006), further reinforcing the importance of the $5,000 handle as the new market baseline.
Forward Outlook: Targeting the 0.618 Extension
With the 0.5 Fibonacci level successfully established as support, technical analysts are now looking toward the upper resistance boundaries. A sustained breakout from the current consolidation channel is expected to target the 0.618 Fibonacci retracement at $5,141.05. A daily close above this “Golden Ratio” would likely trigger an aggressive rally toward $5,300 and potentially the previous all-time highs.
- Upside Trigger: A clean break above the $5,045 local high will confirm the end of the corrective phase.
- Downside Risk: Failure to sustain the 0.5 support could lead to a deeper re-test of the 50-day SMA near $4,703.
Technical Support & Resistance Matrix
| Strategic Level | Price Point | Technical Significance |
|---|---|---|
| Upper Target (0.618 Fibo) | $5,141.05 | Trend Continuation Milestone |
| Dynamic Resistance | $5,006.49 | 21-Day Simple Moving Average |
| Major Support (0.5 Fibo) | $4,999.94 | Psychological & Structural Floor |
| Critical Floor | $4,703.94 | 50-Day Simple Moving Average |
Disclaimer: This analysis is based on real-time Fibonacci measurements and technical indicators. Trading gold involves significant risk due to high market volatility. Always perform independent due diligence before executing trades.