

Gold trades bearish at $3,981 — extending a multi-day decline from the $4,200 zone as the 15-minute structure confirms a descending channel with no credible base yet established. The sole macro event capable of reversing today’s trajectory is the U.S. Core PCE Price Index release at 15:30 UTC+3, which will either validate the dollar’s recent strength or hand gold its first meaningful technical recovery of the week.
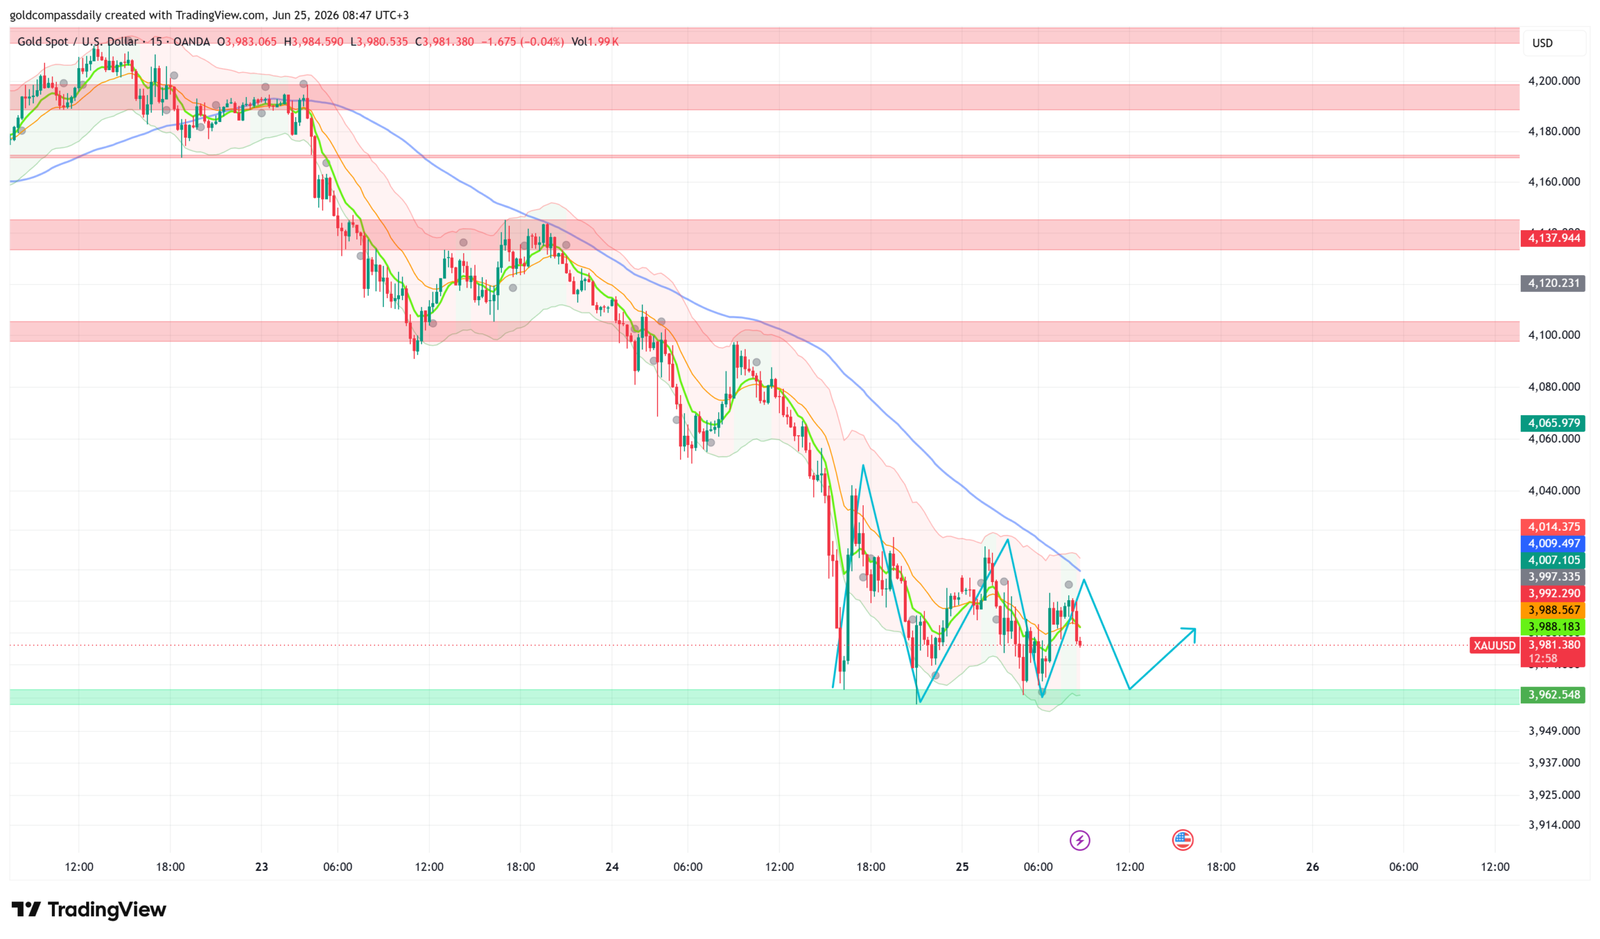
Key Levels
- Bias: Bearish below $4,066
- Support: $3,962 → $3,950
- Resistance: $3,988–$3,992 → $4,007–$4,014 → $4,066
- Session target (bull): $4,007–$4,014 (conditional on soft Core PCE print)
- Session target (bear): $3,962 (on hot PCE or sustained dollar bid)
- Invalidation: Break and close below $3,962 opens path toward $3,925–$3,914 zone
Catalyst of the Day
The U.S. Core PCE Price Index for May prints at 15:30 UTC+3 and represents the Federal Reserve’s preferred inflation gauge. A reading at or above the 0.3% forecast reinforces the case for higher-for-longer rates, strengthening the dollar and sustaining gold’s current selling pressure. A softer-than-expected print — below 0.2% — would undercut the dollar’s recent bid and give gold the macro catalyst it needs to attempt a recovery toward $4,007–$4,014. Alongside PCE, markets will simultaneously digest Final GDP (1.6% forecast), Unemployment Claims (225K), and Durable Goods Orders (-5.0%) — all releasing at the same timestamp. The combination creates a high-volatility window. Watch for the initial 5-minute reaction candle at 15:30 before drawing conclusions.
Fundamental Context
Gold has declined sharply from the $4,200 region over the past 48 hours, driven by a recovering U.S. dollar and receding safe-haven demand as geopolitical risk premiums compress. The DXY has stabilized following last week’s weakness, removing one of the primary tailwinds that pushed gold to record highs earlier in June. For gold, dollar strength is a direct price headwind — the two assets carry a historically inverse relationship, and the current configuration puts the burden of proof on bulls to produce a macro surprise.
Federal Reserve policy expectations remain the dominant structural driver. With Core PCE still running near 0.2–0.3% monthly, the Fed has little room to pivot toward rate cuts, which limits gold’s upside by keeping real yields elevated. FOMC Member Williams speaks at 22:40 UTC+3 — late in the session — and any hawkish signal would compound downward pressure on gold heading into Friday’s close. Markets are pricing only modest easing for 2026, and each upside data surprise narrows that already thin window further.
Australia’s overnight employment data came in strongly — Employment Change surged to 40.3K against a forecast of 31.2K, with unemployment holding at 4.4% — a result that has limited risk-off flows into gold from the Asian session. German GfK Consumer Climate improved marginally to -27.8 from -29.8, signaling slight stabilization in European sentiment, which also reduces defensive gold demand. The macro backdrop, taken in full, is not constructive for gold at current levels absent a clear dovish shock from PCE.
Chart Analysis
The 15-minute XAU/USD chart confirms a clean bearish descending channel structure extending from the $4,200 zone on June 23 through current price at $3,981. The blue 200-period moving average slopes sharply downward and sits well above price near $4,066 — acting as dynamic resistance. The shorter-term green and orange moving averages have converged and are also tracking below the 200MA, confirming trend alignment to the downside. Price is currently attempting a consolidation above the $3,962 demand zone — a green support band visible on the chart — with the projected path (cyan arrow) suggesting a potential lower-high bounce toward $3,992–$4,007 before another leg lower. The cluster of resistance levels between $3,988 and $4,014 is dense and aligns with prior structure. A sustained close above $4,014 on strong volume would be the first credible signal of a trend shift; absent that, the path of least resistance remains south toward the $3,962 floor and potentially $3,914 beyond it.
Bull / Bear Scenarios
Bull Scenario
Trigger: Core PCE prints below 0.2% m/m AND Unemployment Claims exceed 230K → Gold breaks above $3,992 with follow-through volume → Target: $4,007–$4,014. Secondary extension possible toward $4,066 if dollar sells off sharply.
Bear Scenario
Trigger: Core PCE prints at 0.3% or above → Gold fails to hold $3,980 on the reaction candle → Target: $3,962. A confirmed breakdown below $3,962 on closing basis opens the $3,925–$3,914 range into Friday.
Events Ahead
- Thu Jun 25 — 15:30 UTC+3 — Core PCE Price Index m/m (forecast 0.3%): Primary inflation signal for the Fed; hot print extends gold’s decline, soft print triggers recovery attempt.
- Thu Jun 25 — 15:30 UTC+3 — Final GDP q/q (forecast 1.6%) + GDP Price Index (3.5%): Confirms or revises Q1 growth picture; elevated GDP deflator keeps rate cut expectations suppressed — bearish for gold.
- Thu Jun 25 — 15:30 UTC+3 — Unemployment Claims (forecast 225K): Rising claims above 235K would signal labor softening — supportive for gold via rate cut repricing.
- Thu Jun 25 — 15:30 UTC+3 — Durable Goods Orders m/m (forecast -5.0%): Follows last month’s 8.0% surge; a sharp contraction confirms front-loaded demand pull-forward — mixed impact but watch DXY reaction.
- Thu Jun 25 — 22:40 UTC+3 — FOMC Member Williams Speaks: Late-session risk; any hawkish commentary on inflation persistence would extend dollar strength and pressure gold into Friday’s open.
- Fri Jun 27 — End of month, end of quarter: Portfolio rebalancing flows can generate outsized gold volatility independent of data — monitor price action from the European open.
For the weekly macro framework, see the Gold Week Ahead: June 23–27 hub article. For Wednesday’s session recap and prior structure, see Gold Stabilizes at $4,077 as Dollar Pressure Eases.
New York Session Update
Price Check
Gold has staged a sharp intraday reversal, recovering from the morning low near $3,976 to trade at $4,015 at the time of writing — reclaiming the $4,000 handle and trading directly into the resistance cluster identified in this morning’s analysis. The bearish thesis from the morning session has been partially challenged, though no structural trend reversal has been confirmed.
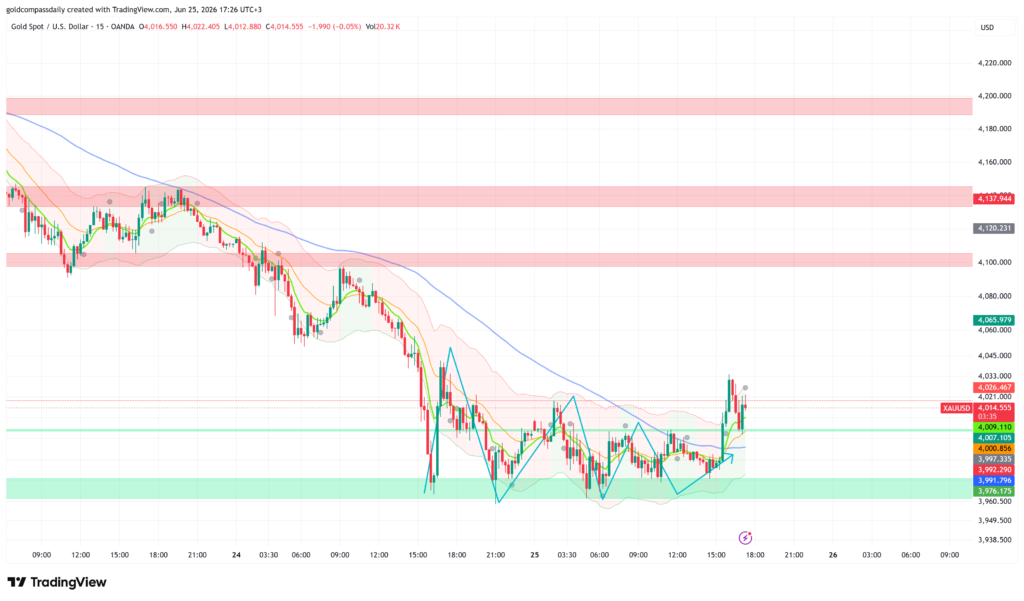
What Changed
The U.S. Core PCE Price Index for May printed at 0.2% m/m — one tick below the 0.3% consensus forecast — triggering a dollar sell-off and an immediate gold bid. Simultaneously, Durable Goods Orders collapsed to -9.3% against a -5.0% forecast, and Personal Spending came in at 0.5% versus a 0.6% expectation, painting a picture of softening U.S. economic momentum. The combination of below-target inflation and weak demand data pushed rate-cut repricing into the market, removing the key pillar that was sustaining gold’s selling pressure through the Asian and early European sessions. The move was amplified by short covering as price cleared $4,000 — a psychologically significant level that had capped prior recovery attempts throughout the day.
Updated Levels
- Current price: $4,015
- Bias now: Neutral-to-cautiously bullish — the soft PCE print shifts the intraday bias, but price remains below the 200MA and within a broader downtrend; conviction is limited until $4,026–$4,033 is cleared
- Updated support: $4,000 → $3,976
- Updated resistance: $4,021 → $4,026–$4,033 → $4,066
- NY session target: $4,026–$4,033 on sustained dollar weakness; $3,992–$4,000 on reversal
Scenarios Into the Close
Bull: Price holds above $4,007 on any pullback and breaks $4,026 on volume → extension toward $4,033 and a test of $4,066 into Friday’s open. Bear: Price fails at $4,021 and loses $4,000 on a closing basis → return to $3,976–$3,962 support band, reinstating the morning’s bearish structure.
Chart Analysis
The 15-minute chart shows a decisive spike from the $3,976 demand zone (lower green band), with price surging through the $4,000–$4,009 cluster in a single impulsive candle at the PCE release. The session high reached $4,022 before a mild pullback settled price near $4,015. The blue 200-period moving average continues to slope downward from above and currently sits near $4,026–$4,033 — the zone that represents the clearest structural resistance for the NY close. Short-term EMAs (green and orange) have turned upward following the spike and are beginning to cross bullishly in the $4,005–$4,009 zone, providing near-term support. The broader pattern on the chart — a channel base between approximately $3,976 and $4,030 — remains intact, with the projected path (cyan line) suggesting a potential retest of the upper channel boundary near $4,026–$4,033 before direction is resolved. A close above that band on the daily candle would be the first technically significant signal of a potential trend shift; failure to hold $4,000 reinstates the bear case in full.
Analysis based on the XAU/USD 15-minute chart as of June 25, 2026, 08:47 UTC+3. This article is for informational and educational purposes only and does not constitute financial advice.