

Gold trades cautiously bullish at $4,433 as two competing forces clash at a pivotal support zone: a hawkish Federal Reserve Chair Kevin Warsh sent September rate hike odds above 60%, hammering the metal nearly 3% on Friday, while fresh US military strikes on Iran overnight have reignited a geopolitical risk premium that could cushion further downside. The market’s next directional move hinges on which force dominates the Asian and early European sessions — and on the August NFP print due Friday.
Key Levels
- Bias: Cautiously Bullish above $4,420 — below that, the structure turns bearish on the 4H timeframe
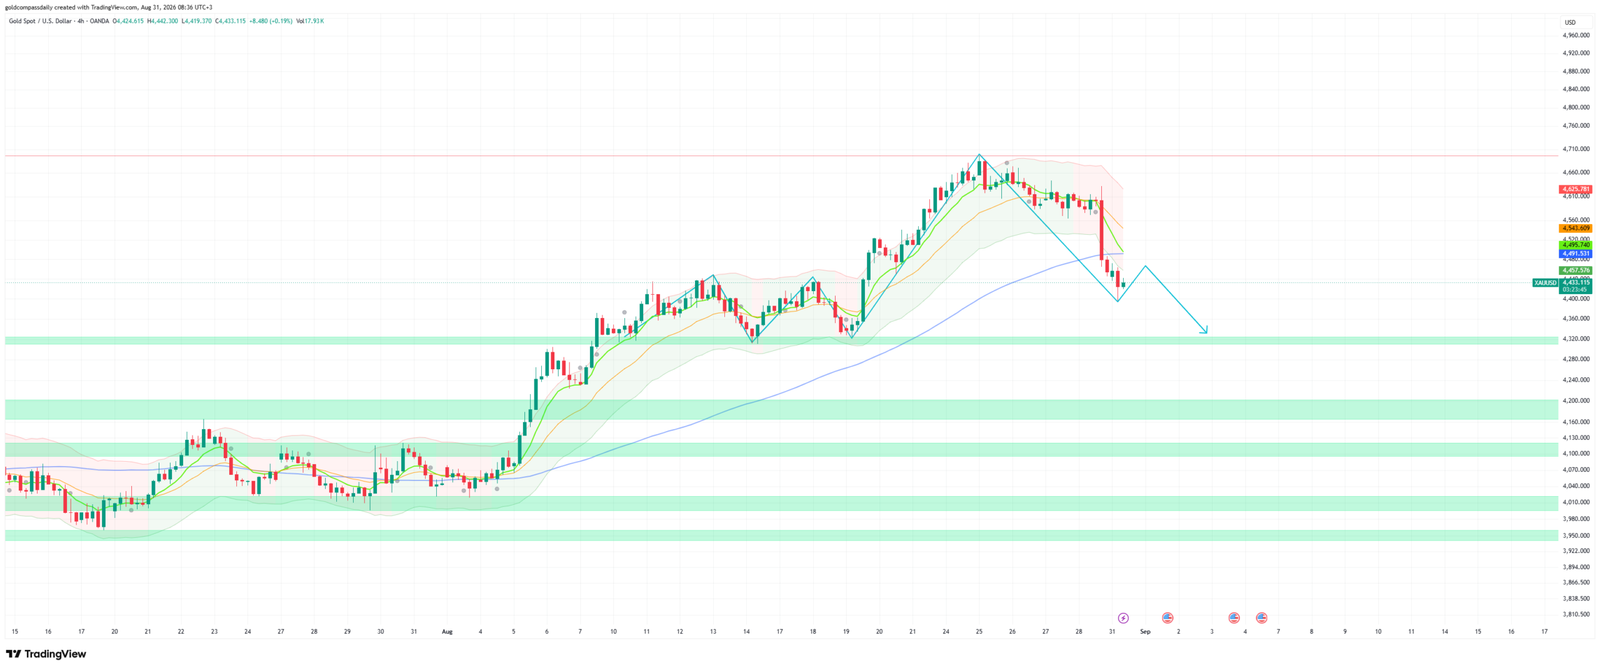
- Support: $4,420 → $4,360 → $4,320 (200-period MA / structural floor)
- Resistance: $4,472 (Asian session high) → $4,520 (prior structure) → $4,550 (key level box)
- Session target: $4,472–$4,520 retest conditional on Iran risk premium holding and USD unable to extend Friday’s gains
- Invalidation: Below $4,420 on a 4H close = bearish breakdown targeting $4,360 and opening the door to the $4,320 long-term support cluster
Catalyst of the Day: The Warsh-Iran Double Bind
The single most consequential development for gold this session is the collision between two narratives that would ordinarily move the metal in opposite directions. On Friday, Fed Chair Warsh delivered what FXStreet’s Speechtracker rated at 7.4 out of 10 on the hawkish scale — well above his 6.5 historical average. He warned that better summer inflation readings do not yet signal a meaningful shift in underlying price trends and stated explicitly that the Fed has “work to do” unless it becomes confident inflation is moving toward the 2% target. Markets responded immediately: CME FedWatch now prices a 60.4% probability of a September rate hike, up sharply from 39.9% pre-speech. Overnight, US forces struck Iranian launchers on Larak Island — the first known American strikes on Iranian territory since late July — and Iran’s IRGC retaliated with ballistic missile strikes on US bases in Jordan. Oil prices moved higher, reigniting inflation fears that paradoxically bolster the case for the very Fed hike that weighs on gold. Gold traders must now navigate a market where the geopolitical safe-haven bid and the rate-hike headwind are simultaneously in play. The resolution of this tension — likely through the USD’s direction in the London open — will determine whether gold stabilizes at $4,420–$4,433 support or accelerates lower.
Fundamental Context
The dominant macro story for gold is the reversal in Fed rate-hike expectations triggered by Warsh’s Jackson Hole speech. Prior to the symposium, the August rally — gold’s strongest monthly gain this century at roughly 14% — had been built on the assumption that the Fed would remain on hold. Warsh’s hawkish tilt reversed that assumption in a single session. Higher expected interest rates increase the opportunity cost of holding non-yielding gold: every percentage point of additional rate-hike probability priced in is a direct headwind for XAU/USD. The dollar’s response on Friday — a sharp intraday surge — compounded the pressure, as a stronger USD makes gold more expensive for non-dollar buyers globally. The key data point to watch is whether the USD can hold its gains in a holiday-thinned session; with UK markets closed for a bank holiday and liquidity reduced, outsized moves in either direction are possible.
The second macro layer is geopolitical — and its interaction with gold is no longer straightforward. The US-Iran conflict that escalated from February 2026 has historically triggered safe-haven flows into gold, but the market has learned that when escalation drives oil prices higher, the resulting inflation impulse strengthens the dollar and reinforces rate-hike expectations, actually creating a net headwind for bullion rather than a tailwind. This dynamic is in play again today: fresh strikes pushing crude higher feeds directly into the Fed hike narrative. The net effect is that geopolitical risk adds volatility without providing a clean directional catalyst — gold faces two-sided risk around every headline. Looking ahead to Friday’s August NFP, the July print of -23,000 jobs against a forecast of +79,000 represented a significant miss that should logically reduce the urgency of Fed tightening. A second consecutive weak labor print on September 5 could rapidly unwind this week’s hawkish repricing and restore gold’s bullish structure. Conversely, a jobs beat above 100,000 would cement September hike expectations and push gold toward the $4,320 long-term support test.
Chart Analysis
The 4H OANDA chart shows gold completing a sharp parabolic advance from the $4,320 structural support zone in early August all the way to the $4,690 peak reached on August 19–20 — a near-14% rally in under three weeks driven entirely by collapsing rate-hike expectations and safe-haven accumulation. The subsequent two-candle correction that followed the $4,690 high is aggressive in both pace and size, a hallmark of a genuine structural shift rather than a routine pullback. Price currently sits at approximately $4,433, directly on the first meaningful support zone visible on the chart. The fast moving average (green) has crossed below the mid MA (orange-yellow), both now pointing lower, while the slower blue MA is still rising from below near the $4,320–$4,340 zone — that confluence of the long-term MA and prior structural demand is the critical floor to defend. The Bollinger Bands have expanded sharply, and price is pressing the lower band, which raises the probability of a short-term mean-reversion bounce toward the $4,472–$4,520 zone before any further downside. The chartist’s projected path drawn on the chart — a bounce attempt followed by continuation lower toward the $4,360 area and ultimately a $4,320 test — is structurally consistent with the 4H picture. Gold Compass Daily confirms the bearish bias on the 4H timeframe while flagging that the $4,420–$4,433 zone must hold as the line between a tactical bounce and a breakdown.
Bull and Bear Scenarios
Bull Trigger
A 4H close above $4,472 — the Asian session intraday high — confirms the short-term mean-reversion bounce. This opens a measured move toward $4,520, and if London buying confirms the move, the $4,550 resistance cluster becomes the session target. This scenario requires the USD to fail to extend Friday’s gains and for Iran escalation headlines to shift the risk balance toward safe-haven flows over inflation fears.
Bear Trigger
A 4H close below $4,420 removes the current support floor and signals the projected continuation lower in the chartist’s path. Initial target: $4,360 (next visible horizontal support). If the USD breaks higher and September hike odds approach 65%+, the $4,320 structural cluster — where the slow 200-period MA is rising — becomes the next major test. A close below $4,320 on the daily chart would signal a full reversal of the August rally structure.
Events Ahead: Aug 31 – Sep 5
- Monday, Aug 31 (All Day) — German Prelim CPI m/m (forecast: 0.3%, prior: 0.8%): A soft German CPI print would reinforce global disinflation and reduce pressure on the ECB, weakening the EUR-driven USD bid that is currently weighing on gold.
- Monday, Aug 31 (All Day) — G20 Meetings (Day 3): Any coordinated statement on geopolitical de-escalation or global growth concerns could shift risk sentiment and affect gold’s safe-haven demand.
- Tuesday, Sep 1 — US ISM Manufacturing PMI: A sub-50 print would add to labor market weakness signals, incrementally reducing the case for a September Fed hike and providing gold with a short-term relief catalyst.
- Wednesday, Sep 3 — US JOLTS Job Openings: Directly informs the Fed’s view on labor market tightness; a sharp decline supports the dovish case for gold.
- Wednesday, Sep 3 — US ADP Nonfarm Employment: Acts as a pre-cursor to Friday’s NFP; a miss below 50K would build the bear case for a weak NFP print and provide the strongest gold catalyst of the week before Friday.
- Thursday, Sep 4 — US ISM Services PMI + Jobless Claims: Services activity data completes the pre-NFP picture; a soft reading amplifies the labor weakness narrative.
- Friday, Sep 5 — US Nonfarm Payrolls (forecast: ~75K, prior: -23K) + Unemployment Rate + Average Hourly Earnings: The week’s defining event for gold. A sub-50K print — following July’s -23K shock — would sharply reduce September hike probability and could trigger a $100+ recovery in XAU/USD. A print above 150K with earnings acceleration would confirm hawkish repricing and accelerate the move toward $4,320.
For the full week-ahead breakdown of scenarios and key levels, see Gold Compass Daily’s Gold Week Ahead: Aug 31 – Sep 5 — NFP Meets Fed Hike Shock. For context on Friday’s positioning ahead of Warsh’s speech, see Gold at $4,576 — Support Test Ahead of the Fed’s Warsh Speech.
London Session Update
Price Check
Gold trades at $4,436 as of 11:16 UTC+3, holding within two dollars of the morning’s $4,433 reference price — the original cautiously bullish bias above $4,420 has not been invalidated, but the London open delivered a sharp test of that conviction before price found footing.
What Changed
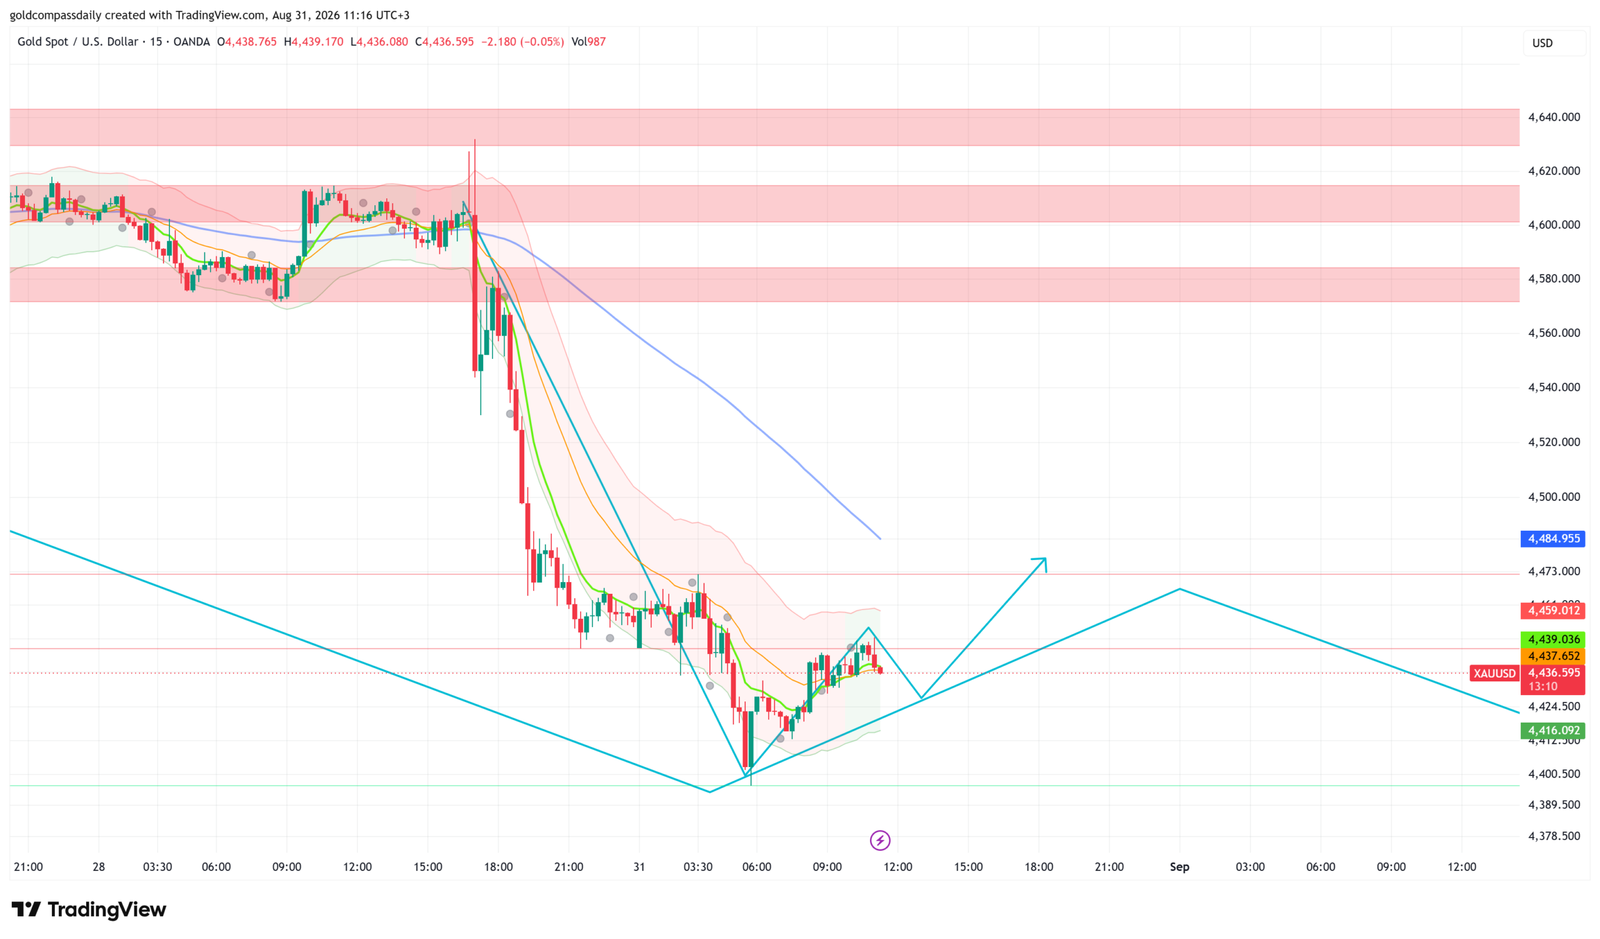
The defining event since the morning analysis was a violent London open flush that drove gold to an intraday low of approximately $4,403 — breaching the $4,420 support level cited in the morning analysis before recovering sharply. The move carries the hallmarks of a stop hunt rather than a genuine structural break: the wick extended well below $4,420 but price recovered immediately and has since consolidated in a narrow channel between $4,424 and $4,439. German Prelim CPI for August came in soft at the headline level, reinforcing the global disinflation narrative and removing one pillar of the hawkish USD bid that pressured gold on Friday. With UK markets closed for a bank holiday, London liquidity is thinner than usual, which amplifies the significance of the stop-hunt flush and the subsequent recovery — institutional buyers appear to have absorbed the move rather than adding to it.
Updated Levels
- Current price: $4,436
- Bias now: Cautiously Bullish — unchanged, but conditional on holding $4,416 on any retest
- Updated support: $4,416 (15M structure low from the London flush) → $4,403 (intraday wick low / hard floor)
- Updated resistance: $4,439 (channel ceiling / current consolidation top) → $4,473 (15M descending trendline) → $4,485 (blue level box)
- London session target: $4,473 breakout on a clean 15M close above $4,439
Scenarios into the NY Handoff
Bull: A 15M close above $4,439 — the channel ceiling — confirms the stop-hunt reversal and opens a measured move toward $4,473, with $4,485 as the stretch target into the NY open. Bear: A failure to break $4,439 followed by a 15M close below $4,416 signals the channel is resolving lower, targeting a retest of the $4,403 flush low and raising the probability of the $4,360 continuation leg flagged in the morning analysis.
Chart Analysis
The 15M OANDA chart tells a clear two-act story. Act one: a near-vertical sell-off from the $4,600 zone beginning around 17:00 UTC+3 on August 30, accelerating through the Asian session and into the London open, with price printing the session low near $4,403 around 06:00 UTC+3 — a drop of roughly $200 from the prior day’s highs. Act two: a sharp V-shaped recovery that has consolidated into a symmetrical channel between $4,424 and $4,439, visible from approximately 07:00 UTC+3 onward. The fast MA (green) and mid MA (orange) are both flat-to-slightly-rising within the channel, a sign that short-term momentum has neutralized. The slower blue MA is descending from above near $4,473 — that is the dynamic resistance that price must clear to confirm a genuine reversal rather than a dead-cat consolidation. The chartist’s projected path drawn on the chart maps a breakout above the channel ceiling toward $4,473, a pullback to retest the channel, and then a continuation higher toward $4,485 into the September 1 session — a structure consistent with the cautiously bullish bias maintained since the morning. The red resistance bands at $4,580 and $4,600–$4,640 remain the macro ceiling for the week. Gold Compass Daily’s morning analysis projected a bounce toward $4,472–$4,520 conditional on the $4,420 floor holding — the London flush tested and, on a closing basis, respected that condition.
Gold at $4,180: XAU/USD Eyes $4,190 as Canada CPI Looms
Gold trades cautiously bullish at $4,180 — price is holding above a…
Gold at $4,174: Gold Eyes US Import Prices, $4,200
Gold trades cautiously bullish at $4,174 — buyers defend every dip above…
XAU/USD at $4,142: Gold Eyes US Retail Sales & PPI
Headline Thesis Gold trades cautiously bullish at $4,142 — the V-shaped recovery…
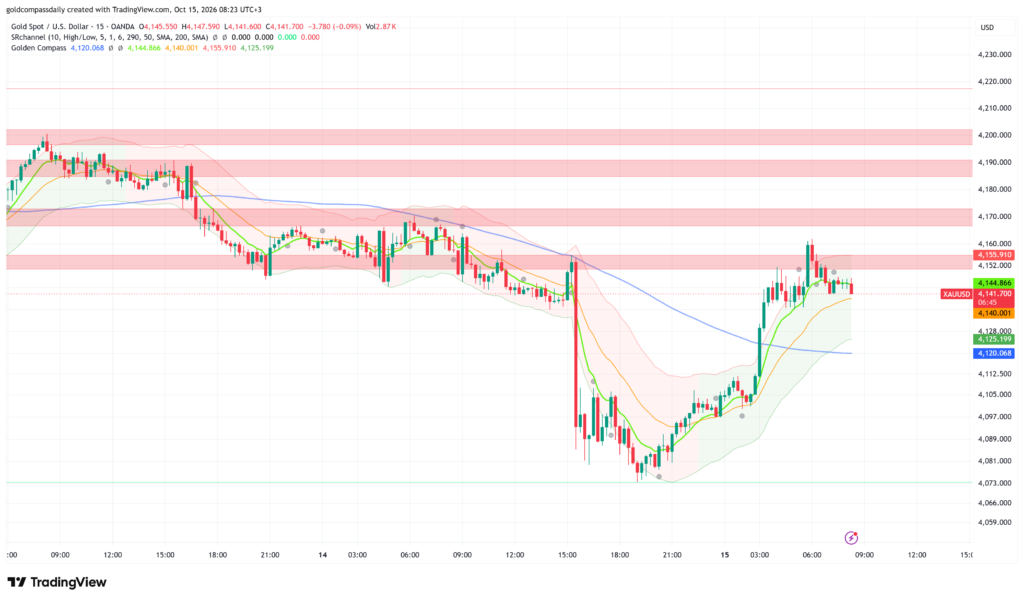
XAU/USD at $4,150: Gold Eyes Bounce Before US CPI
Gold trades cautiously bullish at $4,150 — the $4,145 floor has absorbed…
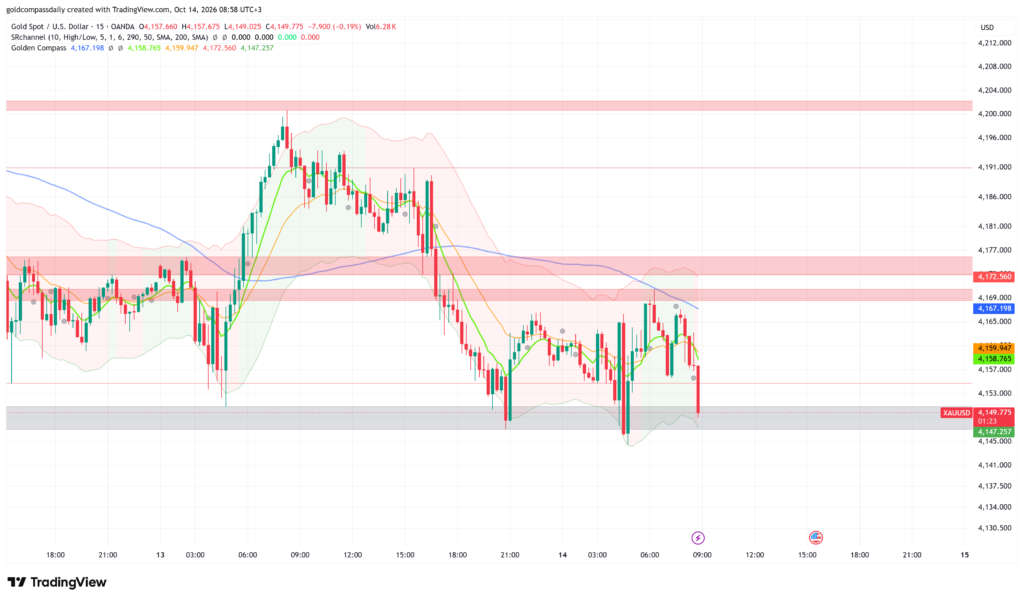
Gold at $4,193 Tests $4,200 Ahead of Waller
Gold trades cautiously bullish at $4,193 — a 50-dollar rebound from the…
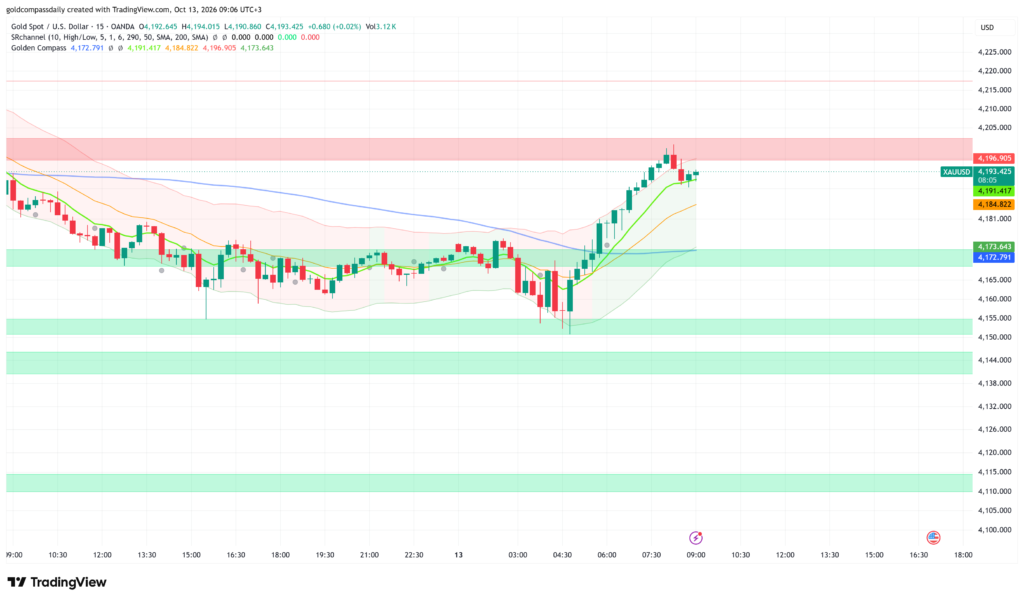
XAU/USD Gold $4,184: Bulls Defend 4,165 on Thin Volume
Gold trades cautiously bullish at $4,184 — the Friday breakout above $4,200…
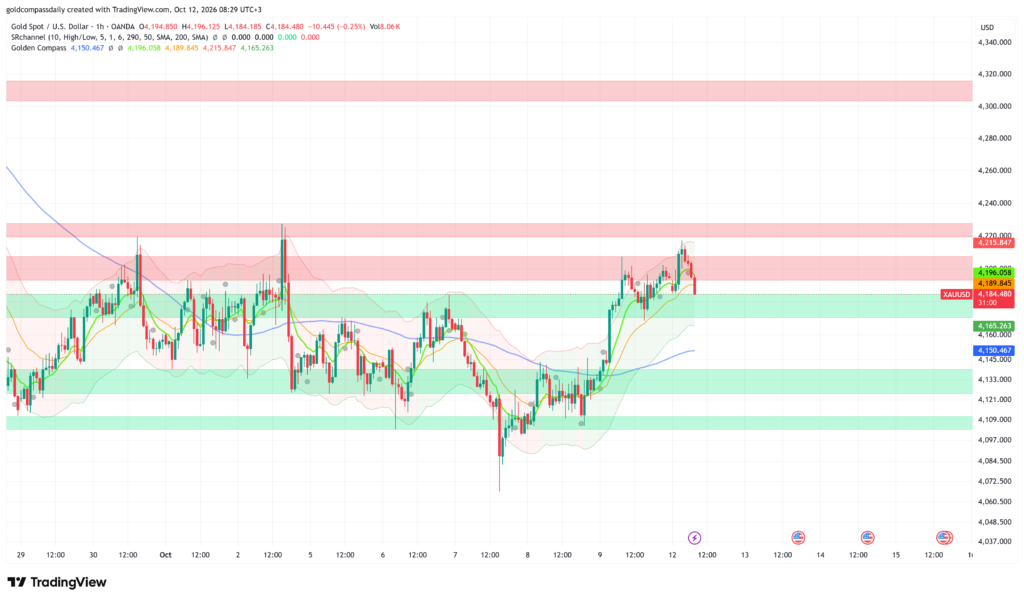
New York Session Update
Price Check
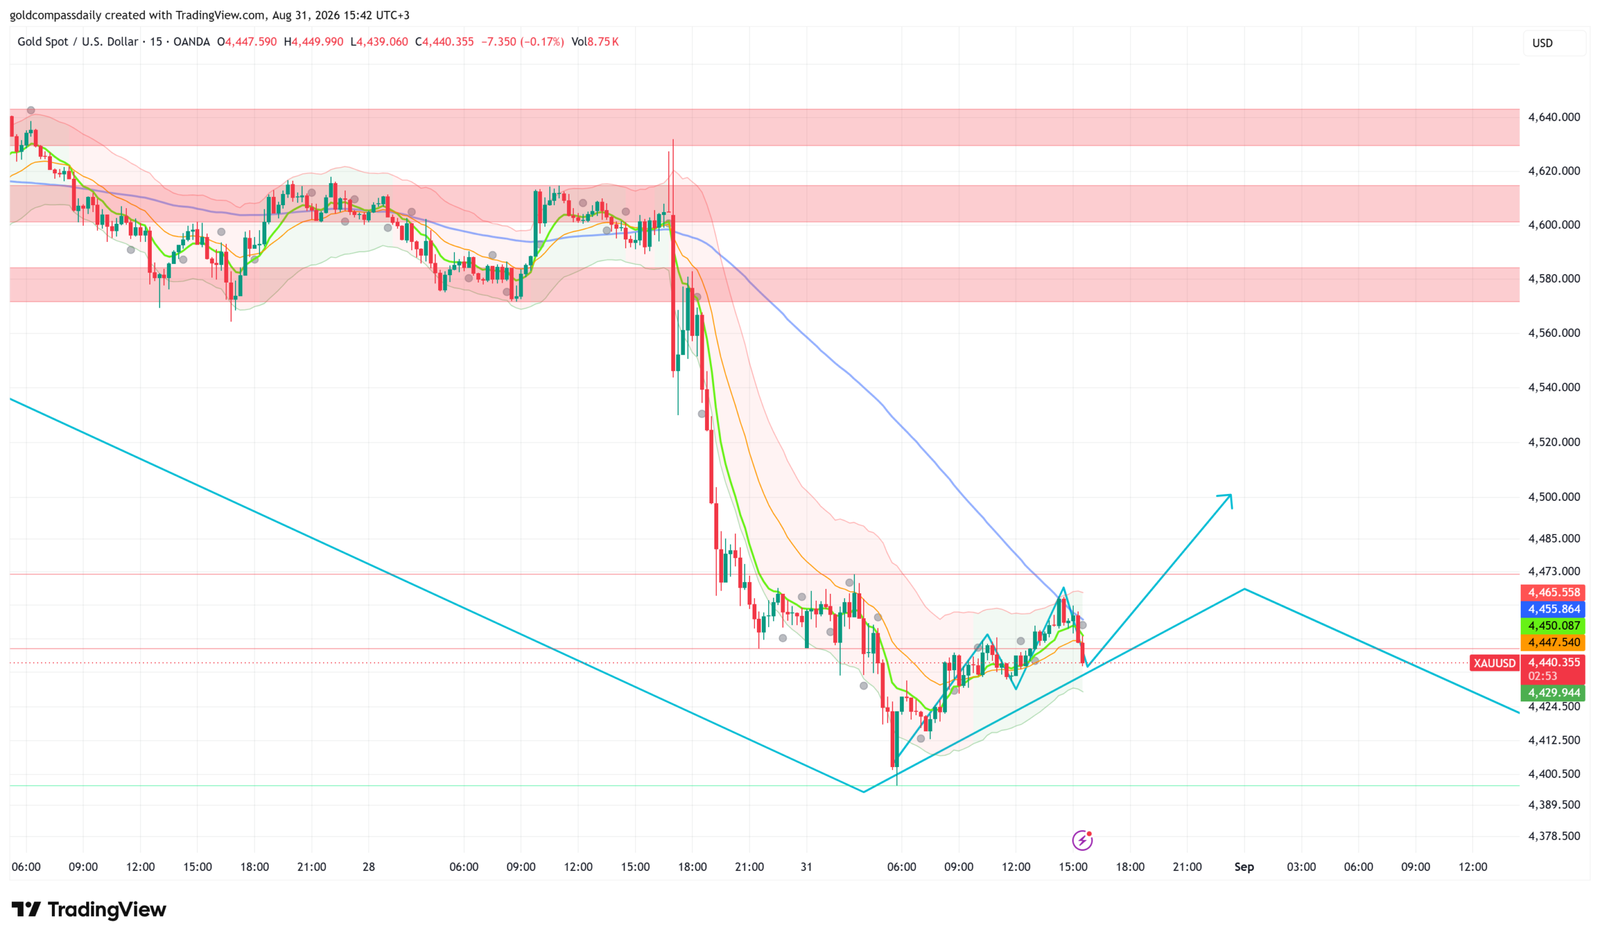
Gold trades at $4,440 as the New York session opens, recovering roughly $37 from the London session low of $4,403 — the morning’s cautiously bullish bias above $4,420 has held, and the consolidation structure that formed through the London update is now attempting to resolve higher ahead of the US handoff.
What Changed
The London channel breakout flagged in the midday update materialized, with price printing a session high near $4,465 before pulling back into a tighter consolidation band between $4,429 and $4,455. The move confirmed that the $4,403 flush was indeed a stop-hunt low rather than a structural breakdown. Chicago PMI came in below expectations at the US open, adding to the week’s softening data picture and incrementally reducing the urgency of the Fed’s September hike case — a modest tailwind for gold that has helped sustain the recovery without yet providing the momentum for a decisive breakout. The DXY has stalled after Friday’s Warsh-driven surge, which is the single most important development sustaining gold’s bid: dollar exhaustion at resistance is creating the breathing room gold needs to consolidate gains rather than retest lows.
Updated Levels
- Current price: $4,440
- Bias now: Cautiously Bullish — confirmed, consolidation above $4,429 is constructive
- Updated support: $4,429 (consolidation floor / 15M structure) → $4,416 (London session low) → $4,403 (hard floor)
- Updated resistance: $4,450 (immediate ceiling) → $4,465 (session high) → $4,473 (descending trendline / London update target)
- NY session target: $4,473 on a clean 15M close above $4,465, with $4,500 as the stretch target if the descending trendline gives way on volume
Scenarios into the Close
Bull: A 15M close above $4,465 on any pickup in volume confirms the consolidation has resolved higher, targeting $4,473 and opening a run toward $4,500 into the Monday close. Bear: A 15M close below $4,429 signals the recovery has stalled and rotates the bias back to neutral, with a retest of $4,416 and the risk of revisiting $4,403 before Tuesday’s Asia open.
Chart Analysis
The 15M OANDA chart shows gold has completed a textbook three-phase structure since the August 30 highs: a near-vertical sell-off from $4,620 to the $4,400 low, a sharp V-shaped recovery to $4,465, and a current symmetrical consolidation wedge compressing between $4,429 and $4,455 — all contained within a widening ascending channel drawn from the $4,400 session floor. The fast MA (green) and mid MA (orange) have both curled upward and are now supporting price from below within the consolidation zone, a constructive signal. The slow blue MA is descending from above near $4,473, converging with the descending trendline that has capped every recovery attempt since the London open — that confluence at $4,473 is the key technical gate for the NY session. The chartist’s projected path drawn on the chart maps a continuation of the current consolidation toward the $4,440–$4,450 zone, followed by a breakout targeting $4,500 into the September 1 open, with an alternate scenario showing a pullback to retest $4,424 before the next leg higher. The red resistance bands at $4,580 and $4,600–$4,640 remain the macro ceiling. Gold Compass Daily’s morning analysis identified $4,473 as the primary resistance and session target — that level remains the definitive line between a recovering market and one that still has unfinished business to the downside.
New York Close & Asian Session Outlook
NY Close
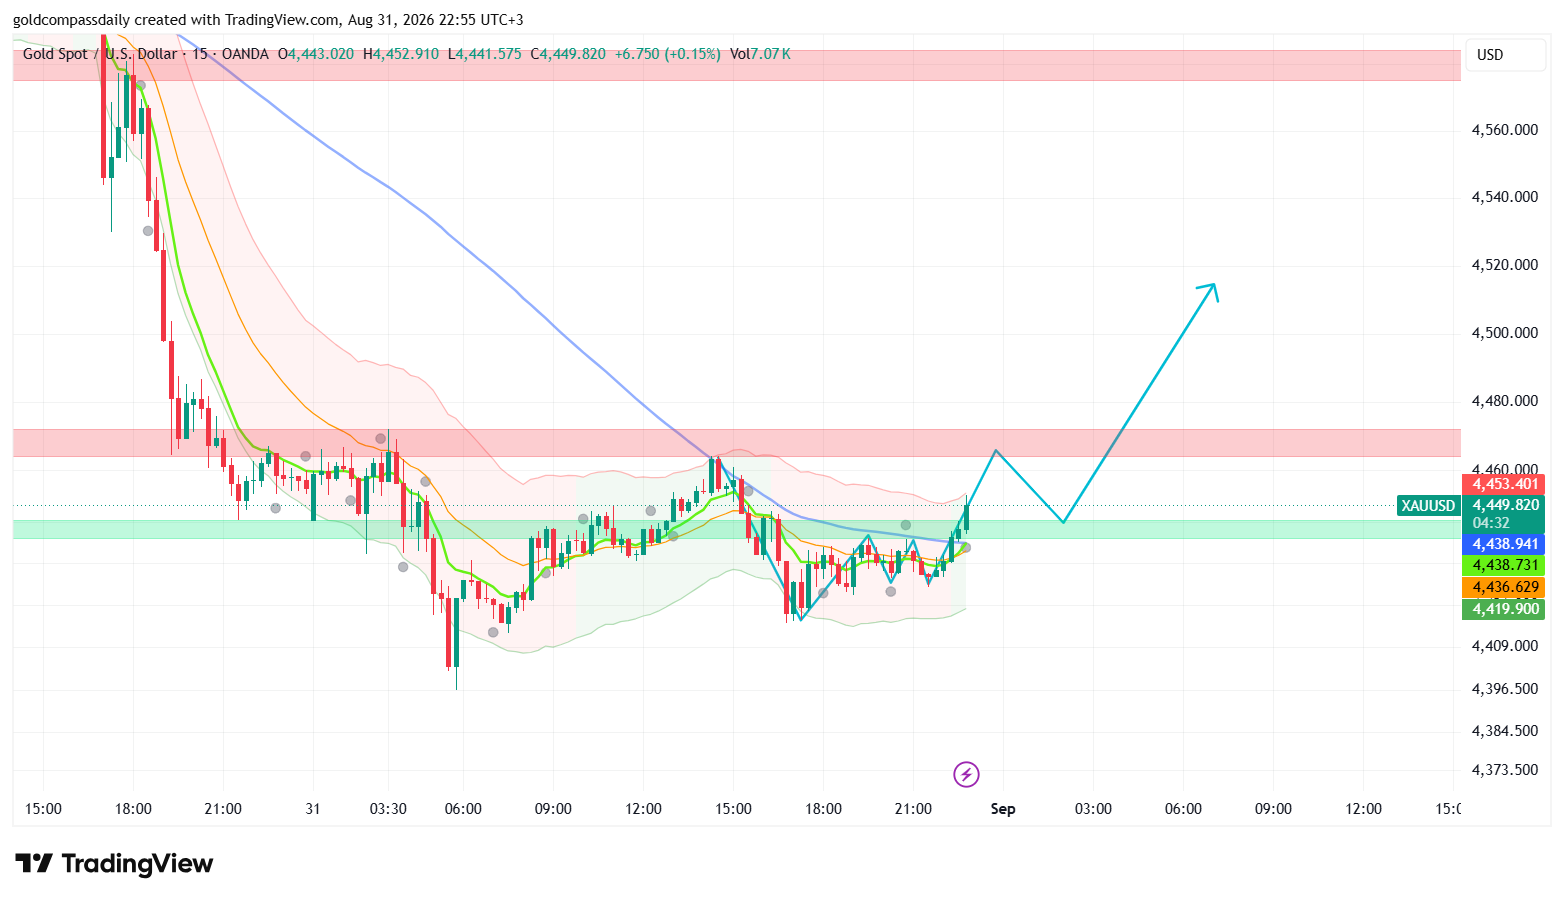
Gold closed the New York session at $4,449 — bullish — confirming the morning’s cautiously bullish thesis above $4,420 as price recovered the full London flush and printed a higher close than the pre-London open level. The day that began with a stop-hunt to $4,403 ended with gold reclaiming $4,449 and pressing the upper boundary of the green demand zone, a result that vindicates the buy bias maintained throughout all three session updates.
Updated Key Levels
- NY Close: $4,449
- Session high: $4,453 / Session low: $4,403
- Bias into Asian session: Bullish above $4,438
- Asian session support: $4,438 (green demand zone upper boundary) → $4,419 (demand zone floor)
- Asian session resistance: $4,453 (NY session high) → $4,460 (pink resistance band) → $4,473 (descending trendline)
Chart Read at Close
The 15M OANDA chart closes with price sitting at $4,449, firmly inside the green demand zone that spans approximately $4,419–$4,450 and has contained price action for the entire second half of the New York session. The fast MA (green) has crossed back above the mid MA (orange) — the first bullish MA cross since the August 30 sell-off — and both are rising from within the demand zone, confirming that short-term momentum has flipped. The Bollinger Bands have contracted sharply after the day’s volatility, with price pressing the upper band at the close — a sign of controlled buying rather than exhaustion. The closing candle is a small-bodied bull candle with minimal upper wick, indicating buyer control at the bell. The chartist’s projected path arrow points decisively higher toward $4,520, with the immediate trajectory targeting a move through the $4,460 pink resistance band and the $4,473 descending trendline in the Asian and early London sessions.
Asian Session Outlook
The Asian session (00:00–09:00 UTC+3) is most likely to open with a brief consolidation or shallow liquidity sweep of the $4,438 demand zone floor before attempting to push through the $4,453–$4,460 resistance band. Thin Asian liquidity following the month-end close raises the probability of a stop sweep below $4,438 before any genuine upside continuation — that sweep, if it occurs, should be treated as an entry opportunity rather than a bearish signal. The level to watch is $4,419: a 15M close below that level would invalidate the demand zone and shift the overnight bias to neutral ahead of Tuesday’s London open.
Next Day Bull / Bear Scenarios
Bull trigger: A 15M close above $4,460 during Asian or early London session confirms the demand zone has launched the next leg, targeting $4,473 and opening $4,500–$4,520 into Tuesday’s full session. Bear trigger: A 15M close below $4,419 — the demand zone floor — removes the bullish structure established today and rotates bias back to neutral, targeting a retest of $4,403 and raising the risk of the $4,360 leg flagged in the morning analysis.
Tomorrow’s Key Events
- 15:00 UTC+3 — US ISM Manufacturing PMI (forecast: ~48.5): A sub-48 print would deepen the softening labor and activity narrative, reducing September hike probability and providing gold’s strongest Tuesday catalyst for a move above $4,473.
- 15:00 UTC+3 — US Construction Spending m/m: Secondary indicator — a miss alongside weak ISM compounds the dollar headwind for gold.
- All Day — G20 Meetings (closing session): Any coordinated statement on geopolitical de-escalation or global growth policy could shift safe-haven flows and introduce intraday volatility.
Analysis based on the XAU/USD 4H chart as of August 31, 2026, 08:36 UTC+3. This article is for informational and educational purposes only and does not constitute financial advice.