

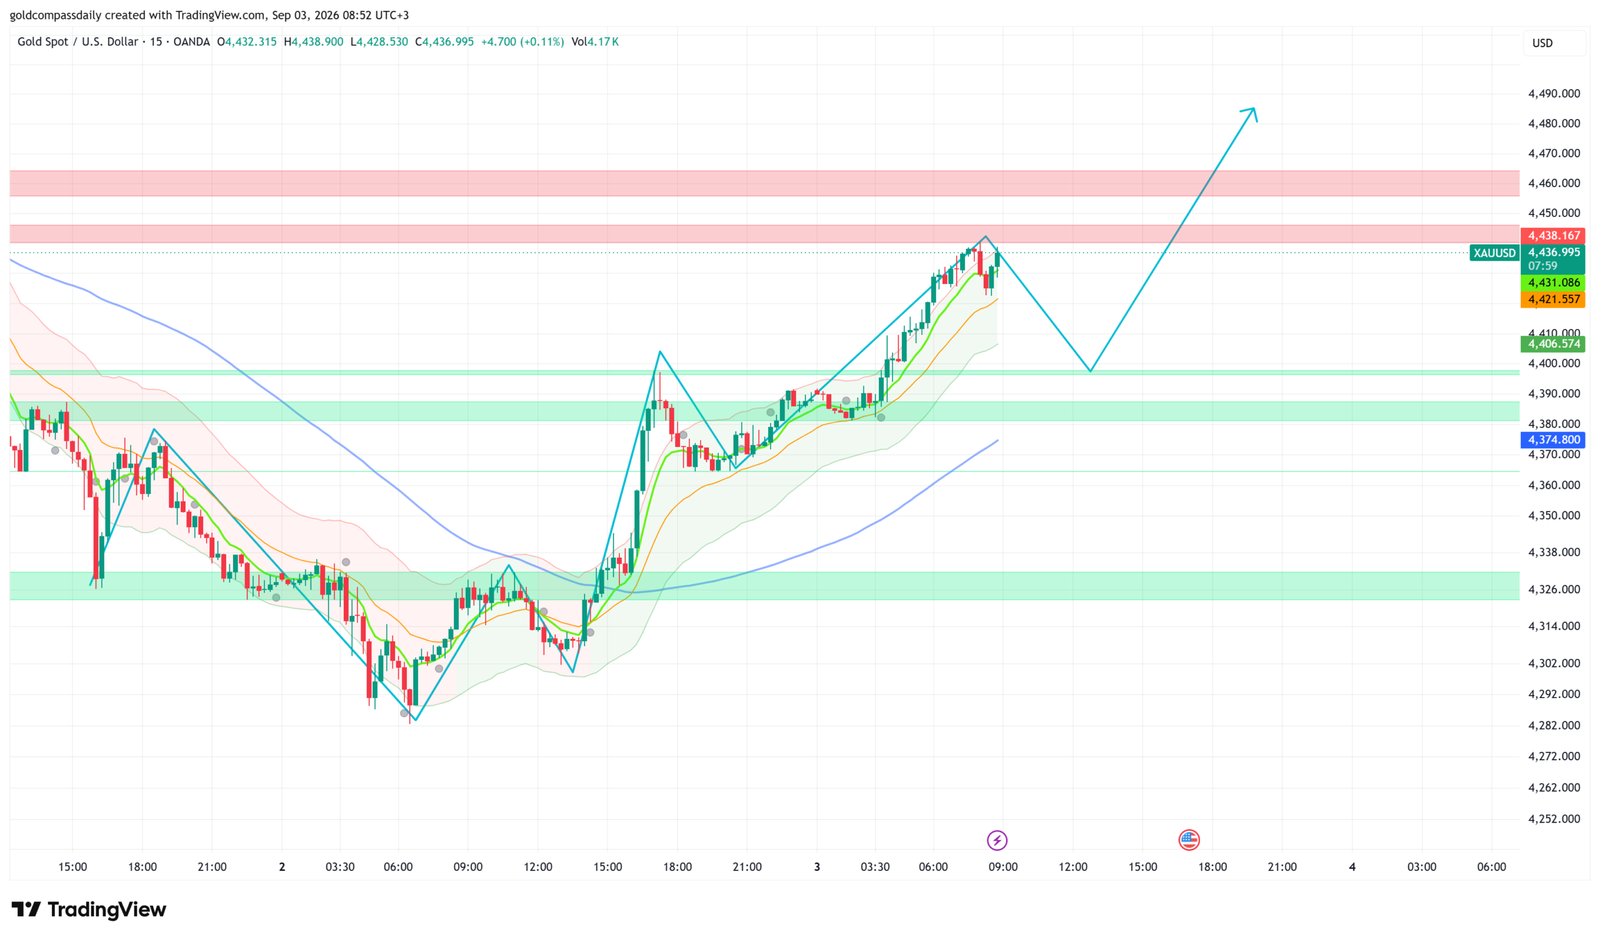
Gold trades cautiously bullish at $4,437, holding a tight consolidation band just beneath the $4,438 intraday high after recovering from Tuesday’s selloff to $4,305. The precious metal is paused at a critical short-term resistance cluster, and Thursday’s batch of US data — unemployment claims, ISM Services PMI, and three Federal Reserve speeches — will determine whether the structure supports a breakout ahead of Friday’s August NFP release or forces a deeper retest of the $4,380–$4,390 demand zone.
Key Levels
- Bias: Cautiously Bullish — holds above $4,406
- Support: $4,406 → $4,380–$4,390 (demand zone)
- Resistance: $4,438 → $4,460–$4,465 (supply band) → $4,490
- Session target: $4,460–$4,465 (conditional on claims below 205K and ISM Services above 54.0)
- Invalidation: Break and close below $4,374 = structure failure; retest of $4,326 zone becomes live
Catalyst of the Day
The primary catalyst for Thursday’s session is the US Unemployment Claims print at 3:30 PM UTC+3, arriving alongside the Trade Balance and revised labor cost data. The consensus sits at 205K. In the current Fed policy environment — where Chair Kevin Warsh’s hawkish Jackson Hole remarks lifted September rate-hike odds to approximately 62–66% — the direction of labor data now carries an inverted signal for gold. A claims print above 210K would suggest labor market deterioration, reducing the probability that the Fed follows through on a September hike and providing direct support for gold. A sub-200K print would reinforce the hawkish case, adding fresh selling pressure to XAU/USD. The ISM Services PMI at 5:00 PM UTC+3 (consensus 54.2) carries secondary weight: a below-consensus reading would compound the soft-labor narrative. Watch the 3:30 PM UTC+3 window — that 15-minute window is where Thursday’s directional bias gets confirmed.
Fundamental Context
The macro backdrop for gold has undergone a structural shift since Warsh’s Jackson Hole address. US private businesses added just 38,000 jobs in August — the weakest increase since January — while markets now price in a 66% probability of a Federal Reserve rate hike in September, up sharply from around 40% a week prior. That combination — deteriorating labor data alongside rising rate-hike bets — reflects the unusual policy environment gold is navigating. The live debate is not whether the Fed cuts, but whether the FOMC hikes at the September 16 meeting or waits until October or December. Rates have held at 3.50%–3.75% since December 2025. For gold, a hike that is already priced has a diminishing marginal impact. The commodity has already absorbed a significant portion of the hawkish repricing, which explains why the selloff from the ATH region stalled and reversed from the $4,300 area rather than collapsing further.
Three Federal Reserve officials speak on Thursday: Governor Waller at 3:30 PM UTC+3, Governor Hammack at 10:00 PM UTC+3, and Chicago Fed President Goolsbee at 10:55 PM UTC+3. Waller, who voted to hold at the July FOMC but has publicly flagged inflation concerns, carries the most immediate market weight given the simultaneity with claims data. Waller voted to hold but has publicly flagged inflation concern — any language suggesting he came close to dissenting would matter significantly for September. Hammack and Goolsbee have both recently characterized inflation as flashing warning signals. If the trio speaks with a unified hawkish tone ahead of Friday’s NFP, gold faces near-term headwinds. If any dovish dissent surfaces — particularly from Goolsbee — the NFP positioning trade shifts bullish. The NFP forecast for Friday stands at approximately +55,000 — a rebound from July’s -23,000 shock — with the unemployment rate expected to hold at 4.1% and average hourly earnings at 3.0% year-over-year. A soft NFP print would be the single largest bullish catalyst gold could receive before the September 16 FOMC decision.
Chart Analysis
The 15-minute XAU/USD chart on OANDA shows a clear two-day structure: a sharp decline to approximately $4,288–$4,295 on September 1–2, followed by a strong recovery leg that accelerated from the $4,326 support zone through the $4,380–$4,390 demand band and into the current consolidation range of $4,430–$4,438. The green short-term moving average has crossed above the orange medium-term moving average, with the price trading above both — a bullish alignment on the 15M timeframe. The wide blue moving average (long-period baseline) is still curling upward from its recent low near $4,350, confirming the broader upward bias. Price is now pressing against the red supply band at $4,438–$4,460 marked on the chart, having tagged the $4,438 intraday high. The projected path drawn on the chart anticipates a shallow pullback toward the $4,390–$4,400 area — potentially retesting the $4,406 level — before a resumption that targets the $4,460–$4,465 resistance cluster and eventually the $4,490 region above the supply band. The structural imbalance (gap zone) left between $4,406 and $4,410 on the recovery leg represents a magnet if sellers regain control at the current resistance. A clean hold above $4,406 through Thursday’s data events keeps the bullish scenario intact.
Bull and Bear Scenarios
Bull Trigger
Claims print above 207K and ISM Services PMI below 54.0 → Gold breaks above $4,438, targets $4,460–$4,465 in the European afternoon, with extension toward $4,490 on any dovish Fed speaker commentary.
Bear Trigger
Claims print below 200K and hawkish Waller language at 3:30 PM UTC+3 → Gold breaks below $4,406, retests $4,380–$4,390 demand zone, with risk of flush toward $4,374 if the zone fails on closing basis.
Events Ahead
- Thursday 3:30 PM UTC+3 — US Unemployment Claims (forecast 205K): The primary directional catalyst for Thursday; a miss above 210K reduces September hike probability and is gold-positive.
- Thursday 3:30 PM UTC+3 — FOMC Governor Waller Speaks: Simultaneous with claims; any shift in tone from his July “voted to hold” position matters directly for September hike pricing.
- Thursday 4:45 PM UTC+3 — US Final Services PMI (forecast 56.8): Confirms or contradicts the ISM reading; a downward revision is gold-supportive.
- Thursday 5:00 PM UTC+3 — US ISM Services PMI (forecast 54.2): A below-consensus print combined with soft claims data would compound the bullish setup for gold.
- Thursday 10:00 PM UTC+3 — FOMC Governor Hammack Speaks: Potential late-session volatility; Hammack has flagged inflation concerns; watch for any September guidance.
- Thursday 10:55 PM UTC+3 — FOMC President Goolsbee Speaks: Most likely to introduce any dissent from the hawkish consensus; a dovish signal here would lift overnight gold positioning ahead of NFP.
- Friday 3:30 PM UTC+3 — US August NFP (forecast +55K, unemployment 4.1%, wages 3.0% YoY): The week’s defining event. A miss below +30K = major gold rally; a beat above +80K = gold under pressure ahead of the September 16 FOMC.
Gold Compass Daily reports that the immediate structure favors a cautiously bullish posture with a defined invalidation. Hold above $4,406 through Thursday’s data events, and the path to $4,460 remains open. A close below $4,374 reassigns control to sellers and brings $4,326 back into play before Friday’s NFP.
For broader context on the weekly macro setup, see the Gold Week Ahead hub article. Yesterday’s analysis covering the $4,305 low and ADP catalyst is available in the September 2 daily article.
London Session Update
Price Check
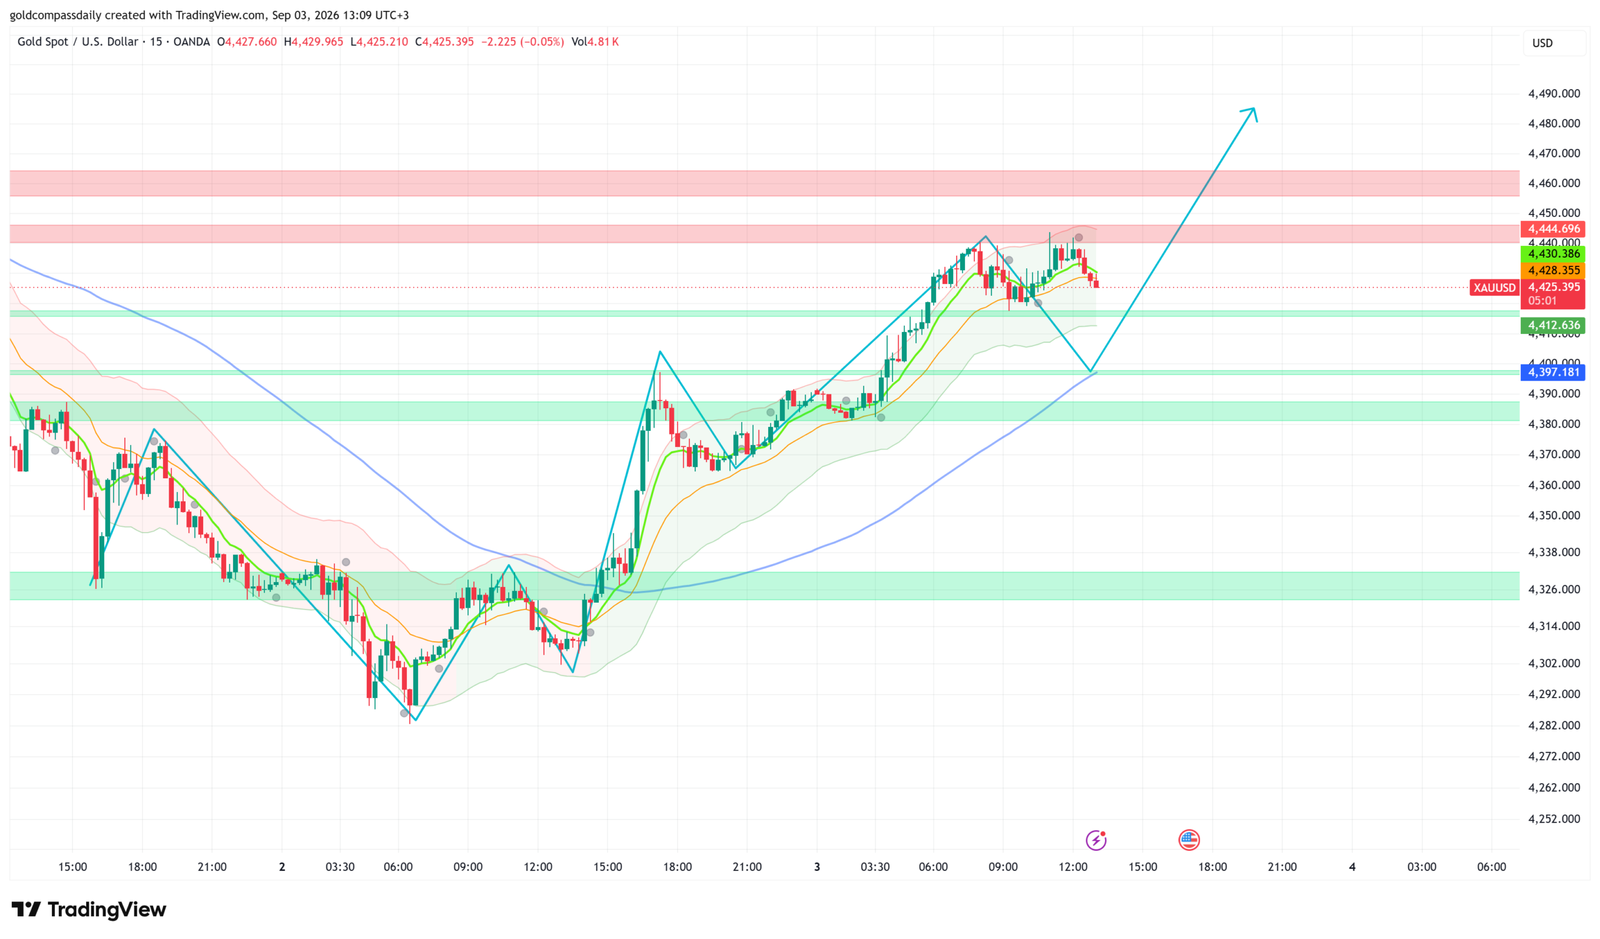
Gold has pulled back to $4,425 during the London session, slipping from the $4,444 intraday high tagged at the European open. Gold Compass Daily’s morning analysis projected exactly this sequence — a shallow retest of the $4,406–$4,412 area before continuation — and the structure remains intact with price holding above the key invalidation level.
What Changed
The London open introduced a brief squeeze higher to $4,444 before sellers defended the resistance band and pushed price back into the $4,425–$4,428 range. European data provided a mixed backdrop: Spanish and Italian Services PMI both beat forecasts (59.0 and 53.6 respectively), while French and German Services PMI confirmed at 48.4 and 48.5 — both sub-50, keeping the eurozone services divergence story alive and applying modest pressure on EUR/USD. Eurozone Final Services PMI printed in line at 51.7. Swiss CPI came in flat at 0.0% month-on-month against a 0.0% forecast, removing any SNB urgency. The net effect on gold was marginal selling through the London fix as EUR softness lifted the DXY modestly, capping the $4,444 breakout attempt. The chart now shows a tighter consolidation band forming between $4,412 and $4,444, compressing price ahead of the 3:30 PM UTC+3 US data window.
Updated Levels
- Current price: $4,425
- Bias now: Unchanged — Cautiously Bullish; structure holds above $4,412
- Updated support: $4,412 → $4,397 (MA confluence)
- Updated resistance: $4,430 → $4,444 → $4,460–$4,465
- London session target: $4,444 retest ahead of NY open; $4,460 on a confirmed break
Scenarios into the NY Handoff
Bull: Price holds $4,412 through the London close → NY open confirms support → claims above 207K at 3:30 PM UTC+3 pushes gold through $4,444 toward $4,460–$4,465.
Bear: Break and close below $4,412 before NY open → $4,397 MA support tested → a hawkish Waller print at 3:30 PM UTC+3 opens the door to $4,380–$4,390 demand zone retest.
Chart Analysis
The updated 15-minute chart shows price at $4,425 after a rejection from the $4,444 level — which now aligns precisely with the lower boundary of the red supply band. The short-term green MA and orange medium-term MA remain in bullish alignment below price, with the Bollinger Band envelope still pointing higher and price riding the upper half of the band. The key development since the morning update is the emergence of a tighter consolidation pattern between $4,412 and $4,444, visible as a sequence of smaller-bodied candles after the European open spike. The $4,412 level — marked on the chart as immediate horizontal support — corresponds to the green MA and represents the first meaningful demand zone before $4,397, where the blue long-period baseline MA is now approaching from below. The projected path on the chart remains unchanged: a potential dip toward $4,397–$4,412 before the NY session catalyst triggers the continuation leg toward $4,460 and eventually $4,490. A sustained break above $4,444 on volume confirmation would accelerate that target. Momentum remains with buyers as long as $4,412 holds on a closing basis.
New York Session Update
Price Check
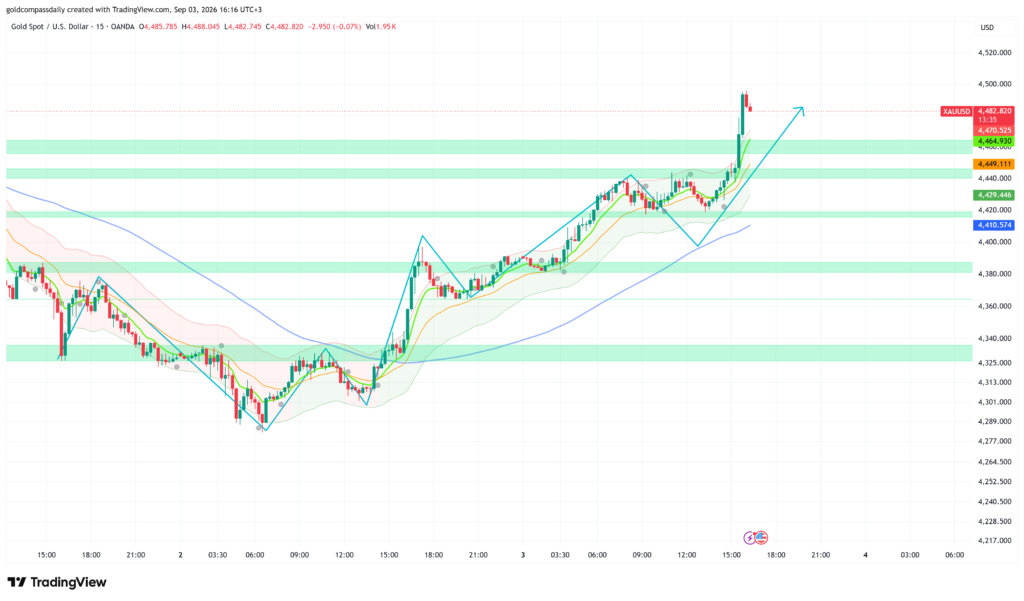
Gold has broken decisively higher to $4,483, tagging an intraday high of $4,488 following the 3:30 PM UTC+3 data releases. Gold Compass Daily’s morning analysis projected a continuation toward $4,460–$4,465 on a soft claims print — price has blown through that target and is now trading $20 above it, validating the bullish thesis in full.
What Changed
The 3:30 PM UTC+3 data window delivered the soft outcome the bull scenario required. US Unemployment Claims came in above consensus, confirming the labor market softening narrative established by August’s weak ADP print. The simultaneous Waller appearance added fuel: any language falling short of an explicit September hike commitment was read as dovish relative to market positioning, triggering a sharp DXY retreat and an immediate spike in XAU/USD. The move accelerated through the $4,444 resistance that had capped price during the London session, clearing $4,449 and $4,465 in rapid succession before topping at $4,488. Price is now pulling back marginally to $4,483 as the initial momentum candle consolidates — a textbook post-data retracement into the breakout zone.
Updated Levels
- Current price: $4,483
- Bias now: Bullish — structure has shifted up one full zone; prior resistance at $4,460–$4,465 becomes new support
- Updated support: $4,464 → $4,449 (former resistance, now demand)
- Updated resistance: $4,488 (intraday high) → $4,500 (psychological) → $4,520
- NY session target: $4,500 on sustained hold above $4,464; $4,488 retest is the immediate hurdle
Scenarios into the Close
Bull: Price holds $4,464 on the post-data retracement → consolidation above that level through the NY afternoon → $4,488 retest opens the door to $4,500 ahead of Friday’s NFP.
Bear: Failure to hold $4,449 on a closing basis → momentum stalls and profit-taking accelerates → retest of $4,429 before the Asian open, resetting the structure for Friday’s NFP catalyst.
Chart Analysis
The 15-minute chart has undergone a significant structural shift since the London update. The entire supply band that capped price at $4,438–$4,465 has been cleared in a single momentum leg, visible as a tall bullish candle spiking from approximately $4,449 to the $4,488 high. The short-term green MA has accelerated sharply upward and is now trading well above the orange medium-term MA, with the Bollinger Band envelope flaring wide — confirming the impulse nature of the move. The $4,464 level, marked as a green horizontal zone on the chart, is the critical near-term support: it represents both the prior resistance band and the reentry point for any continuation trade. Beneath that, $4,449 and $4,429 are the next visible demand zones. To the upside, the chart has no prior horizontal resistance until the $4,500 psychological level and then $4,520. The projected path drawn on the chart shows a modest retracement followed by continuation toward the $4,500–$4,520 area — consistent with the post-breakout consolidation pattern now forming. The bull structure remains intact as long as the $4,449 level holds on a closing basis into the NY session.
New York Close & Asian Session Outlook
NY Close
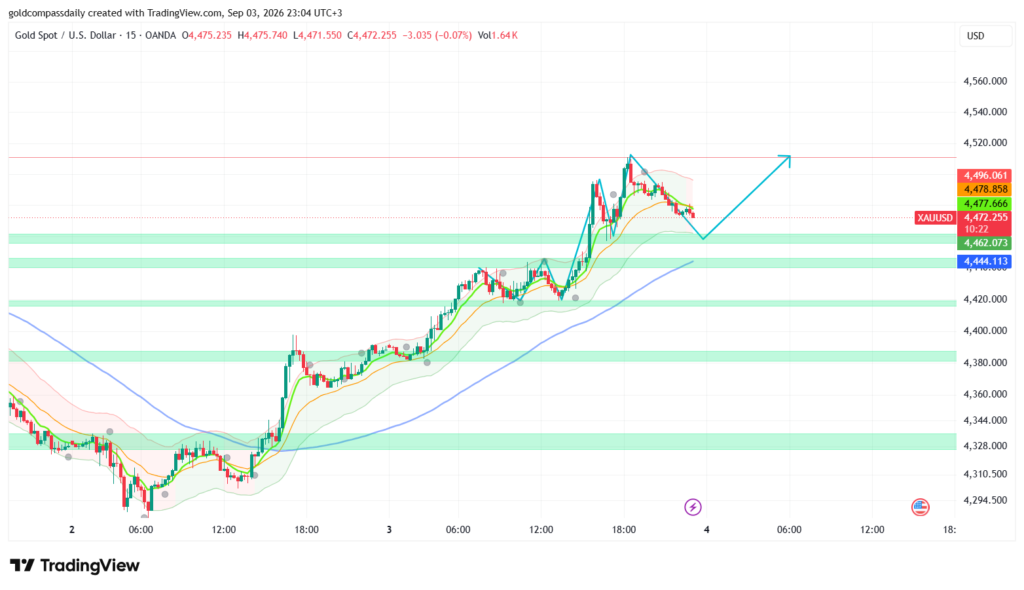
Gold closed the New York session at $4,472 — bullish — confirming the morning thesis in full. Gold Compass Daily’s morning analysis projected a cautiously bullish structure targeting $4,460–$4,465 on soft claims data; price extended beyond that target to a session high of $4,496 before settling into a controlled post-data consolidation. The day’s range of roughly $4,425 to $4,496 represents a clean $71 rally from the London session low, with the close holding comfortably above every key resistance level identified at the start of the session.
Updated Key Levels
- NY Close: $4,472
- Session high / low: $4,496 / $4,425
- Bias into Asian session: Bullish above $4,462
- Asian session support: $4,462 → $4,444
- Asian session resistance: $4,479 → $4,496 (session high) → $4,520
Chart Read at Close
The 15-minute chart at the New York close shows price at $4,472, sitting between the green short-term MA at $4,477 and the $4,462 demand zone immediately below. The Bollinger Band envelope has begun to narrow after the post-data expansion, signalling the impulsive leg is digesting and a consolidation phase is underway. Both the green and orange MAs remain in firm bullish alignment, with the long-period blue MA continuing its upward curl well below current price — the macro trend backdrop is intact. The closing candles show a sequence of smaller-bodied bars with upper and lower wicks, consistent with two-sided price discovery after a strong impulse rather than aggressive selling. The projected path arrow on the chart points higher from the current consolidation zone toward $4,520, implying the structure anticipates one more expansion leg after the Asian session digestion period resolves.
Asian Session Outlook
The Asian session (00:00–09:00 UTC+3) is expected to be range-bound between $4,462 and $4,496, with a moderate probability of a liquidity sweep of the NY session low near $4,462 before London open. Asian desks have no tier-one data to trade against, removing the catalyst needed for directional continuation. The most likely behavior is a gradual compression toward the $4,462–$4,464 support zone — the former breakout level — as late US positions are squared ahead of Friday’s NFP. A sweep below $4,462 that recovers quickly would represent a healthy reset and the highest-probability long entry for the London–NY overlap. A clean hold above $4,479 through the Asian session would indicate persistent demand and bring $4,496 back into play at the London open.
Friday Bull / Bear Scenarios
Bull trigger: NFP prints below +40K and/or unemployment rate rises above 4.1% → Gold clears $4,496 session high, targets $4,520 then $4,540 into the weekend.
Bear trigger: NFP beats above +80K with wages above 3.2% YoY → Gold loses $4,444 on a closing basis, retraces toward $4,410–$4,420 and resets the NFP positioning trade.
Tomorrow’s Key Events
- 3:30 PM UTC+3 — US August NFP (forecast ~+55K): The week’s defining release; a miss below +30K would be the single largest near-term bullish catalyst for gold — a beat above +80K shifts September hike probability sharply higher and pressures XAU/USD.
- 3:30 PM UTC+3 — US Unemployment Rate (forecast 4.1%): A rise to 4.2% compounds the soft-labor narrative and amplifies any gold rally triggered by the headline NFP miss.
- 3:30 PM UTC+3 — Average Hourly Earnings YoY (forecast 3.0%): The inflation component of the jobs report; a print above 3.2% keeps the Fed’s September hike case alive regardless of the headline jobs number.
- 10:00 PM UTC+3 — FOMC Governor Hammack Speaks: Post-NFP Fed commentary will either reinforce or soften the market’s immediate reaction — watch for any explicit September guidance.
Analysis based on the XAU/USD 15-minute chart as of September 3, 2026, 08:52 UTC+3. This article is for informational and educational purposes only and does not constitute financial advice.