

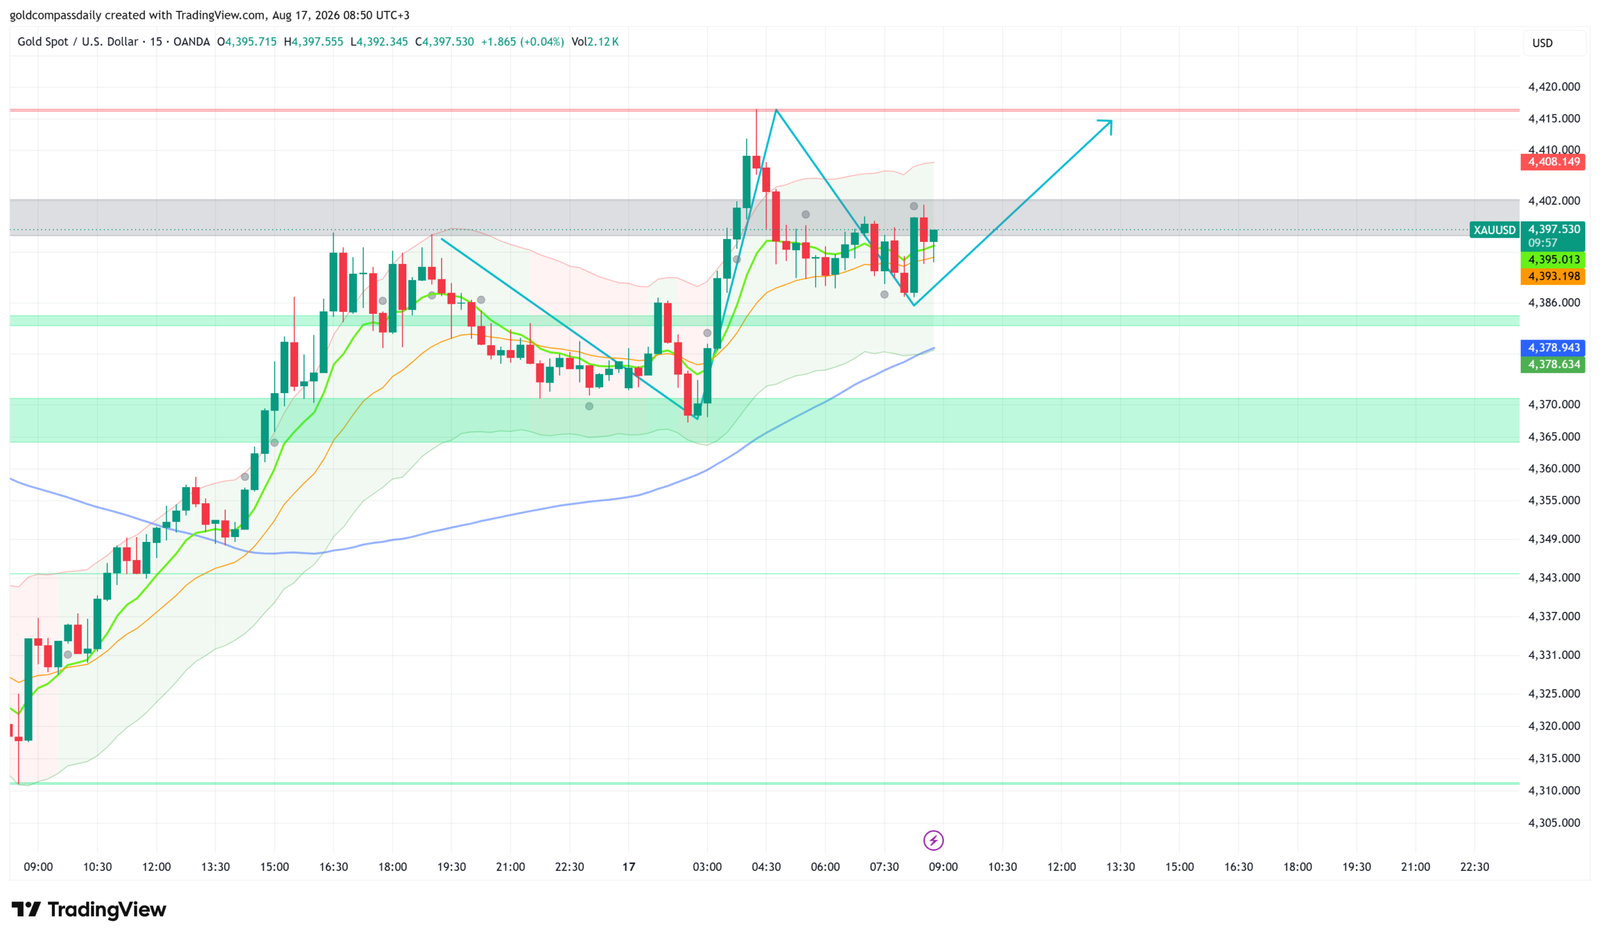
Gold trades cautiously bullish at $4,397, pulling back from an early session spike to $4,415 as price consolidates within a tight $4,393–$4,402 range ahead of the Empire State Manufacturing Index. The broader structure remains constructive — the 15-minute chart shows buyers defending the short-term moving average cluster, and the projected path points toward a retest of the $4,415 high and beyond.
Key Levels
- Bias: Bullish above $4,386
- Support: $4,393–$4,395 (MA cluster) → $4,386 (first green band) → $4,365–$4,370 (deep support zone)
- Resistance: $4,402 (grey band ceiling) → $4,408–$4,410 (session high zone) → $4,415 (spike high / target)
- Session target: $4,415 retest, conditional on Empire State beat and price holding $4,393
- Invalidation: Close below $4,386 on the 15-minute chart shifts bias neutral; below $4,370 invalidates the bull structure
Catalyst of the Day
The Empire State Manufacturing Index (15:30 UTC+3) is the primary US data point on an otherwise light Monday calendar. The forecast stands at 15.6, up from last month’s reading of 10.6. A softer print — particularly a miss that raises recession risk or signals renewed industrial weakness — would be gold-positive, reinforcing the safe-haven and rate-cut narrative that has driven XAU/USD to all-time highs in 2026. A strong beat, by contrast, reduces Federal Reserve pressure to ease and could prompt a short-term dollar bid that pressures gold back toward $4,386 support. Watch the reaction in DXY immediately following the 15:30 UTC+3 release — the dollar response will confirm which scenario unfolds.
Fundamental Context
Gold’s Monday consolidation follows a week in which US CPI, PPI, Retail Sales, and University of Michigan Sentiment collectively shaped Fed expectations. With Chair Kevin Warsh maintaining the hawkish-hold posture, the market is priced for patience — yet gold’s sustained hold above $4,390 suggests institutional demand is not waiting for a pivot confirmation. Real yield compression and ongoing geopolitical hedging continue to provide a structural floor under price, independent of short-term data noise.
The Asian session data released overnight adds limited direct weight for gold. Japan’s Preliminary GDP q/q printed at 0.3% against a 0.5% forecast — a soft read that modestly supports yen strength narratives but does not materially alter the gold picture. China’s data package at 10:00am (UTC+3) showed Industrial Production at 5.0% versus a 5.3% prior, with Retail Sales at 1.5% versus 1.0% prior — a mixed read that confirms demand recovery without signalling overheating. Softer Chinese industrial output marginally reduces industrial gold demand expectations but is unlikely to override the safe-haven macro bid. Canada CPI data at 15:30 UTC+3 runs concurrently with Empire State and could amplify or dampen risk sentiment depending on its trajectory relative to Bank of Canada expectations.
The NAHB Housing Market Index at 17:00 UTC+3 (forecast 34, prior 33) is a secondary read on US economic health. A significant miss would compound any Empire State weakness and add to the case for gold continuation toward $4,415 and higher. TIC Long-Term Purchases at 23:00 UTC+3 (forecast $232.7B versus prior $151.4B) is the late session wildcard — a large beat indicating strong foreign demand for US assets could produce a brief dollar tailwind, but is unlikely to override the weekly trend.
Chart Analysis
The OANDA 15-minute chart as of 08:50 UTC+3 shows XAU/USD at $4,397.53, sitting just below a grey resistance band spanning approximately $4,398–$4,402. Price spiked to the $4,408–$4,410 area in the early Asian session before pulling back in an orderly consolidation — a constructive structure that indicates profit-taking rather than distribution. The green and orange short-term moving averages have converged around $4,393–$4,395, providing dynamic support that price is currently testing. The blue slow MA is rising near $4,379, confirming the medium-term uptrend is intact. The chart’s projected path (annotated blue arrow) targets a breakout above the grey band, a retest of the $4,408–$4,410 spike zone, and extension toward $4,415. The first key confirmation level is a clean 15-minute close above $4,402 — that opens the path to the session high target. The $4,386 green support band below is the structural floor for the bull case.
Bull / Bear Scenarios
Bull Scenario
Trigger: Price holds above $4,393 on the 15-minute chart and breaks through $4,402 with a confirmed close. Empire State Manufacturing misses the 15.6 forecast or prints near consensus without triggering a dollar rally.
Target: $4,408–$4,410 initial, then $4,415 retest. A sustained close above $4,415 opens the extension toward $4,420.
Bear Scenario
Trigger: A 15-minute close below $4,386 on volume, combined with an Empire State beat driving DXY strength.
Target: $4,370 first, then the $4,365–$4,370 demand zone. A break and hold below $4,365 would shift the session bias to neutral and put the $4,350 area in view.
Events Ahead This Week
- Monday, August 17 — 15:30 UTC+3 — Empire State Manufacturing Index (forecast 15.6): Weak US manufacturing data supports gold’s safe-haven demand; a beat supports the dollar and caps upside.
- Monday, August 17 — 15:30 UTC+3 — Canada CPI m/m (forecast 0.4%): Inflationary read with potential cross-asset ripple into USD pairs and gold.
- Monday, August 17 — 17:00 UTC+3 — NAHB Housing Market Index (forecast 34): Secondary US economic health indicator; a miss amplifies the case for continued gold strength.
- Tuesday, August 18 — US Building Permits and Housing Starts: Continued read on US construction activity; part of the macro deceleration narrative underpinning gold.
- Wednesday, August 19 — FOMC Minutes: The highest-impact event of the week — any dovish signals or dissent on the hold path could drive gold sharply higher toward and above $4,420.
- Thursday, August 20 — US Initial Jobless Claims: Labor market deterioration is gold-positive under the current Fed framework.
- Friday, August 21 — Global Flash PMIs: Synchronized weakness across US, EU, and UK PMIs would reinforce gold’s safe-haven positioning into the weekend.
For the full week-ahead macro breakdown and scenario framework, see the Gold Compass Daily Weekly Hub: August 17–22. Friday’s session analysis covering the drop to $4,311 and the Retail Sales / UoM Sentiment reaction is available here.
Gold Compass Daily reports that the bias for Monday’s session remains bullish while price holds the $4,393–$4,395 MA cluster. The Empire State Manufacturing release at 15:30 UTC+3 is the primary trigger event. A miss confirms the continuation setup toward $4,415; a strong beat requires reassessment at $4,386 support before re-entry.
London Session Update
Price Check
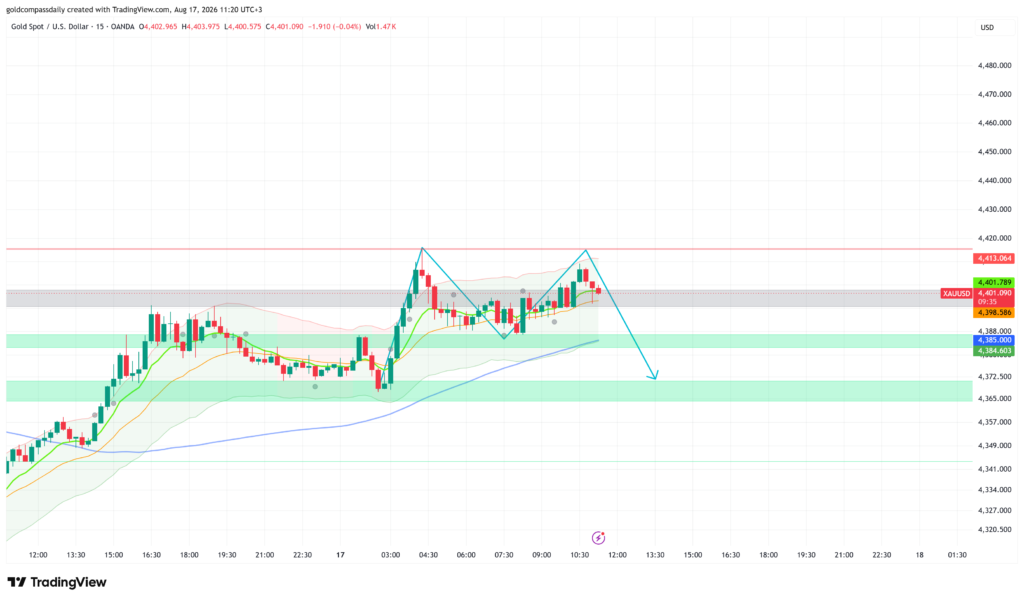
XAU/USD trades at $4,401 as of the London mid-session, having extended to $4,411 following the morning open — broadly in line with Gold Compass Daily’s morning thesis, which identified $4,408–$4,410 as the initial bull target. The bullish bias has held, though price is now consolidating beneath the red resistance line at $4,413 after a double-top structure formed on the 15-minute chart.
What Changed
The chart now shows a completed double-top pattern between the $4,410–$4,413 resistance zone, with the second peak marginally lower than the first — a short-term exhaustion signal at a technically significant ceiling. Price has pulled back into the grey consolidation band ($4,398–$4,403), where the short-term moving averages have converged and are now acting as intraday support. The projected path on the chart shifts cautiously bearish in the near term, with the annotated arrow pointing toward the $4,372–$4,375 green demand zone on a failure to reclaim $4,413. No major European macro catalyst has materially altered the macro picture since the morning; the primary driver for the remainder of the session is the Empire State Manufacturing Index and Canada CPI at 15:30 UTC+3.
Updated Levels
- Current price: $4,401
- Bias now: Cautiously bullish — unchanged above $4,385, but the double-top at $4,413 introduces short-term caution
- Updated support: $4,398–$4,400 (MA cluster / grey band floor) → $4,385 (green band) → $4,372–$4,375 (deep demand zone)
- Updated resistance: $4,408–$4,410 (first peak) → $4,413 (red resistance ceiling) → $4,420 (extension target on breakout)
- London session target: $4,413 breakout confirmation, or $4,385 on a failure of the grey band
Scenarios into the NY Handoff
Bull: Price holds $4,398 through the 15:30 UTC+3 data window and breaks $4,413 on a 15-minute close — opens the path to $4,420 into the New York open. Bear: A 15-minute close below $4,385 on Empire State beat and dollar strength targets the $4,372–$4,375 demand zone, where the bull structure must hold or the session bias shifts neutral.
Chart Analysis
The OANDA 15-minute chart as of 11:20 UTC+3 shows XAU/USD at $4,401.09, consolidating inside the grey resistance band after printing a clear double-top between $4,410 and $4,413. The red horizontal line at $4,413 marks the structural ceiling — two consecutive rejections at this level confirm seller activity. The green and orange short-term MAs have converged around $4,399–$4,401 and are flattening, consistent with the indecision visible in recent candles. The blue slow MA continues to rise near $4,385, confirming the medium-term uptrend remains intact. The annotated bear path targets $4,372–$4,375, the lower green demand band, if the grey consolidation zone fails on a 15-minute close basis. A clean break above $4,413 on volume would negate the double-top and open the extension leg toward $4,420 and beyond.
New York Session Update
Price Check
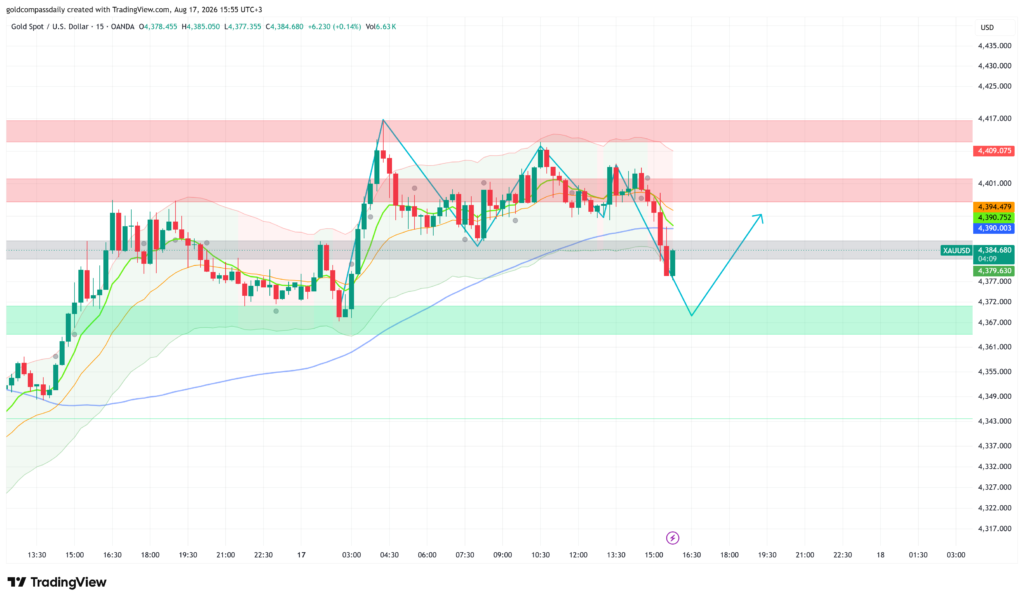
XAU/USD trades at $4,384 at the New York open, having pulled back sharply from the session high of $4,410 — the morning bull thesis delivered on the upside target but is now under pressure as Empire State data hit the tape and triggered a swift reversal toward key support.
What Changed
The Empire State Manufacturing Index printed at 15.6, in line with consensus, removing the downside miss scenario that would have been unambiguously gold-positive. The data-driven dollar bid combined with profit-taking from the $4,410 high produced a rapid two-leg decline that has now pushed price into the grey dotted support band around $4,384–$4,386 — the same structural level Gold Compass Daily’s morning analysis identified as the bull invalidation threshold. The London session double-top at $4,413 flagged in the midday update proved prescient: the second failure at $4,408 confirmed distribution, and price subsequently broke through the $4,398–$4,402 grey band without a meaningful bounce. The short-term MAs have crossed bearish on the 15-minute chart for the first time since the Asian session rally began.
Updated Levels
- Current price: $4,384
- Bias now: Neutral — the bullish structure is under stress; a confirmed hold of $4,379–$4,385 is required to keep the bull case alive
- Updated support: $4,379–$4,385 (grey band / current test) → $4,367–$4,372 (green demand zone, chart annotation low)
- Updated resistance: $4,390–$4,395 (MA cluster, now overhead) → $4,401 (pink band floor) → $4,409 (pink band ceiling / session high zone)
- NY session target: $4,390–$4,395 recovery on a hold of $4,379; or $4,367–$4,372 on a break below $4,379
Scenarios into the Close
Bull: Price holds $4,379 on a 15-minute closing basis and reclaims $4,390 — the projected path on the chart targets a recovery toward $4,395–$4,401 into the NY afternoon. Bear: A 15-minute close below $4,379 confirms the grey band has failed as support and opens the $4,367–$4,372 green demand zone as the next meaningful floor.
Chart Analysis
The OANDA 15-minute chart as of 15:55 UTC+3 shows XAU/USD at $4,384.68, sitting directly on the grey dotted support band after a sharp two-candle drop from the $4,408 area. The decline is the sharpest single move of the session by range, suggesting stop-run activity below the $4,390 cluster. The green and orange short-term MAs have turned down and are now positioned overhead at $4,390–$4,394, acting as immediate resistance on any recovery attempt. The blue slow MA continues to rise near $4,379–$4,380, providing the last dynamic support before the green demand zone at $4,367–$4,372. The chart’s annotated projected path shows a potential dip toward $4,372 followed by a recovery attempt back toward $4,390 — a buy-the-dip structure consistent with the broader uptrend, provided $4,379 holds on a closing basis. The pink resistance bands at $4,401–$4,409 remain the ceiling for any NY session recovery.
New York Close & Asian Session Outlook
NY Close
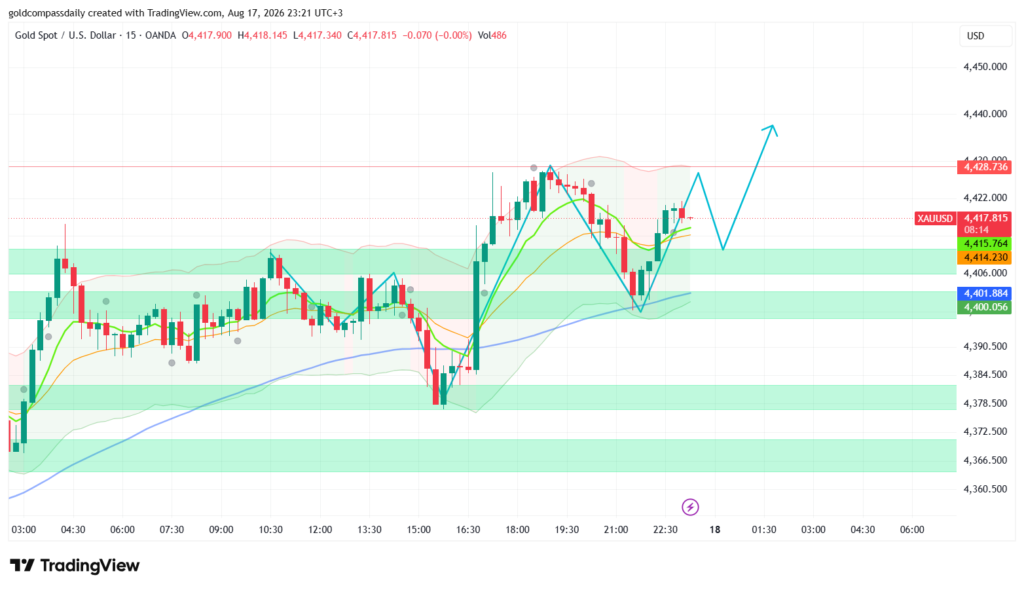
Gold closed the New York session at $4,417.82 — bullish — fully recovering from the Empire State-driven dip to $4,378 and printing a strong close well above the day’s key support zones. Gold Compass Daily’s morning analysis projected a bull target of $4,415, and price not only reached that level but closed above it, confirming the daily thesis with authority.
Updated Key Levels
- NY Close: $4,417.82
- Session high: $4,425 / Session low: $4,378
- Bias into Asian session: Bullish above $4,400
- Asian session support: $4,414–$4,416 (MA cluster) → $4,400–$4,402 (green demand band)
- Asian session resistance: $4,422–$4,425 (session high zone) → $4,429 (red resistance ceiling)
Chart Read at Close
The OANDA 15-minute chart as of 23:21 UTC+3 shows XAU/USD at $4,417.82, positioned above the converged green and orange short-term MAs at $4,414–$4,416 — a bullish configuration that confirms buyer control at the close. The blue slow MA has risen to approximately $4,401, providing a rising dynamic floor well below current price. The Bollinger Bands have expanded to the upside following the sharp recovery rally from the $4,378 low, with price riding the upper band — momentum is intact. The annotated projected path points toward a dip to approximately $4,400–$4,402 during the Asian session before a continuation leg higher toward $4,440+. The closing candle structure is a small-bodied doji near the session high, indicating equilibrium but with the prior rally candles clearly in buyer control.
Asian Session Outlook
The Asian session (00:00–09:00 UTC+3) is most likely to produce a shallow consolidation or liquidity sweep below the $4,414–$4,416 MA cluster before London opens. The projected chart path anticipates a dip toward $4,400–$4,402 — the upper green demand band — as the most probable intraday test. A sweep of the NY session low at $4,378 is not expected unless a macro shock emerges overnight; the more probable scenario is tight range-bound price action between $4,410 and $4,425 ahead of Tuesday’s catalyst slate.
Next Day Bull / Bear Scenarios
Bull trigger: Asian session holds $4,400 and London open breaks $4,425 on a 15-minute close — targets $4,429 red resistance ceiling, then extension toward $4,440. Bear trigger: A 15-minute close below $4,400 during Asian or early London session shifts bias neutral and opens the $4,384–$4,386 grey band as the next test.
Tomorrow’s Key Events
- 15:30 UTC+3 — US Building Permits (forecast ~1.40M) & Housing Starts: Weak construction data adds to US economic deceleration narrative, gold-positive; a beat supports the dollar and could cap upside near $4,425.
- 21:00 UTC+3 — FOMC Minutes: The week’s highest-impact event for gold — any dovish signals, dissent on the hold path, or concern about growth could drive XAU/USD sharply above $4,429 toward $4,440 and beyond.
Analysis based on the XAU/USD 15-minute chart as of August 17, 2026, 08:50 UTC+3. This article is for informational and educational purposes only and does not constitute financial advice.