

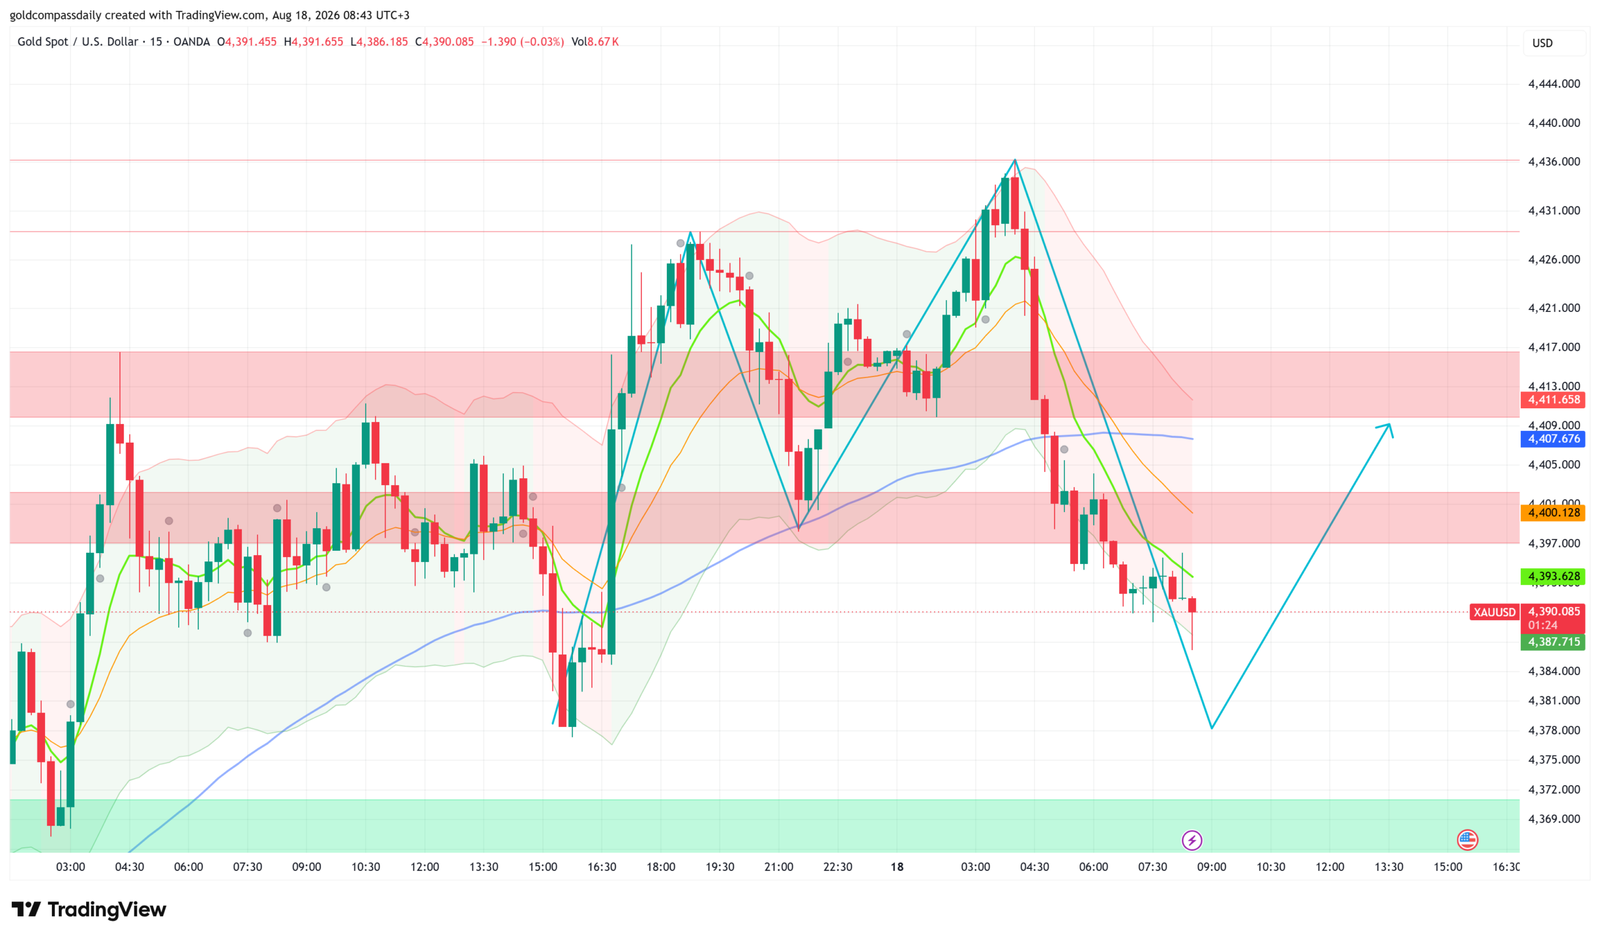
Gold trades cautiously bullish at $4,390.08, retreating from an overnight high of $4,436 as the metal consolidates above critical intraday support ahead of a packed US data session. The pullback follows a sharp rejection from the $4,436 resistance zone, but structure remains intact as long as $4,387 holds — the chart projects a recovery path toward $4,407–$4,411 through the New York session.
Key Levels
- Bias: Bullish above $4,387 | Neutral below
- Support: $4,387.71 → $4,380 → $4,369
- Resistance: $4,393.63 → $4,400.13 → $4,411.66
- Session target: $4,407.68 (conditional on US data missing to the downside)
- Invalidation: Below $4,380 = bearish breakdown, opens path to $4,369 demand zone
Catalyst of the Day
The primary catalyst for Tuesday’s session is the 3:30 PM UTC+3 US Housing Starts and Building Permits release, followed immediately by Import Prices and then Industrial Production at 4:15 PM. Taken together, this data cluster provides the Federal Reserve — and markets pricing Fed Chair Kevin Warsh’s policy path — with a real-time snapshot of domestic demand and cost pressures. A weaker-than-forecast Housing Starts print (consensus: 1.34M; prior: 1.43M already signals softening) would reinforce the narrative that the US economy is losing momentum, reducing the urgency for the Fed to maintain restrictive rates — a gold-positive outcome. Import Prices, forecast at just 0.1% month-on-month, carry a direct inflation signal: a softer reading undermines the dollar and supports gold’s safe-haven premium. Watch the 3:30 PM UTC+3 window for the initial directional break.
Fundamental Context
Gold’s macro backdrop remains structurally supportive. The dollar has failed to sustain meaningful upside despite recent resilience, and real yield compression — driven by a market increasingly pricing in a Fed pivot timeline — continues to provide a floor under gold. The ADP Weekly Employment Change, released at 3:30 PM alongside housing data, offers the first real-time labor snapshot of the week. With the prior reading at 8.3K, any further deterioration would amplify dovish Fed expectations and directly pressures the dollar, the primary inverse driver of XAU/USD at current elevated price levels.
European data released earlier in the session skews risk-neutral for gold. UK unemployment held at 4.9% with claimant count at 6.7K, while Average Earnings moderated to 4.3% — a combination that suggests sticky but decelerating wage pressure, keeping the Bank of England on a cautious easing path without triggering a risk-off spike. The EUR ZEW Economic Sentiment printed at 23.4, below the 25.9 forecast, reinforcing subdued European economic momentum that historically channels safe-haven flows toward gold over the medium term. No single European print today alters gold’s trajectory, but the cumulative picture of softening global growth sustains the fundamental bid.
Chart Analysis
The 15-minute XAU/USD chart on OANDA shows a sharp V-shaped rejection structure that peaked at approximately $4,436 during the early Asian session on August 18, followed by an aggressive selloff that brought price down to a low of $4,387.71 — the current support level marked on the chart. Price is now stabilizing near $4,390, sitting just above the green demand zone ($4,387–$4,393) while below the first resistance cluster at $4,400.13 (the orange key level). Moving averages are in a compressed, mixed configuration following the sharp move lower: the short-term MA (green) has begun curling upward from current levels, while the medium (yellow/orange) and longer-period (blue) MAs are still declining, reflecting the bearish momentum from the overnight rejection. The chart’s projected path — drawn in blue — anticipates a further flush toward $4,379–$4,380 before a recovery move targets $4,407.68 and eventually the $4,411.66 resistance zone by the afternoon session. The upper pink resistance band ($4,413–$4,417) caps the upside scenario for today. Structurally, the key question is whether the $4,387 support holds on any continuation of the morning weakness; a clean bounce from that level with increasing volume confirms the bullish reload thesis.
Bull / Bear Scenarios
Bull Scenario
Trigger: Price holds $4,387 support and US data (Housing Starts, Import Prices) misses forecasts → Target: $4,407.68, then $4,411.66. A softer dollar reaction to weak US housing prints clears the path for a re-test of the $4,400–$4,411 resistance band during New York trade. Confirmation requires a clean 15-minute close above $4,393.63.
Bear Scenario
Trigger: Break and close below $4,387.71 on volume → Target: $4,380, then $4,369. A sustained breach of the current support base, particularly if US data surprises to the upside (strong Industrial Production at 4:15 PM), would extend the Asian session selloff and risk a deeper flush into the lower green demand zone near $4,369. The bull thesis is fully invalidated below $4,380.
Events Ahead
- Tuesday, 3:30 PM UTC+3 — US Housing Starts (1.34M forecast, 1.43M prior): Significant drop expected; miss accelerates dovish repricing and boosts gold.
- Tuesday, 3:30 PM UTC+3 — US Building Permits (1.37M forecast): Confirms or denies housing demand trend; weak print = dollar negative.
- Tuesday, 3:30 PM UTC+3 — US Import Prices m/m (0.1% forecast): Soft reading = reduced inflation pressure = supportive for gold.
- Tuesday, 3:30 PM UTC+3 — ADP Weekly Employment Change (8.3K prior): Labor market softening would reinforce Fed pivot narrative.
- Tuesday, 4:15 PM UTC+3 — US Industrial Production m/m (0.3% forecast): Upside surprise = dollar strength = gold headwind; miss extends bull case.
- Tuesday, 5:00 PM UTC+3 — US Pending Home Sales m/m (0.1% forecast, -5.4% prior): Potential rebound after steep prior drop; market impact secondary to earlier releases.
- Wednesday — FOMC Minutes: Primary event risk for the week; any hawkish shift in Fed language would be the single largest downside risk for gold.
For the week’s full macro framework and scenario analysis, see the Gold Week Ahead: Aug 17–22 hub. Monday’s session analysis is available at XAU/USD Holds $4,397 as Empire State Data Looms — Monday.
London Session Update
Price Check
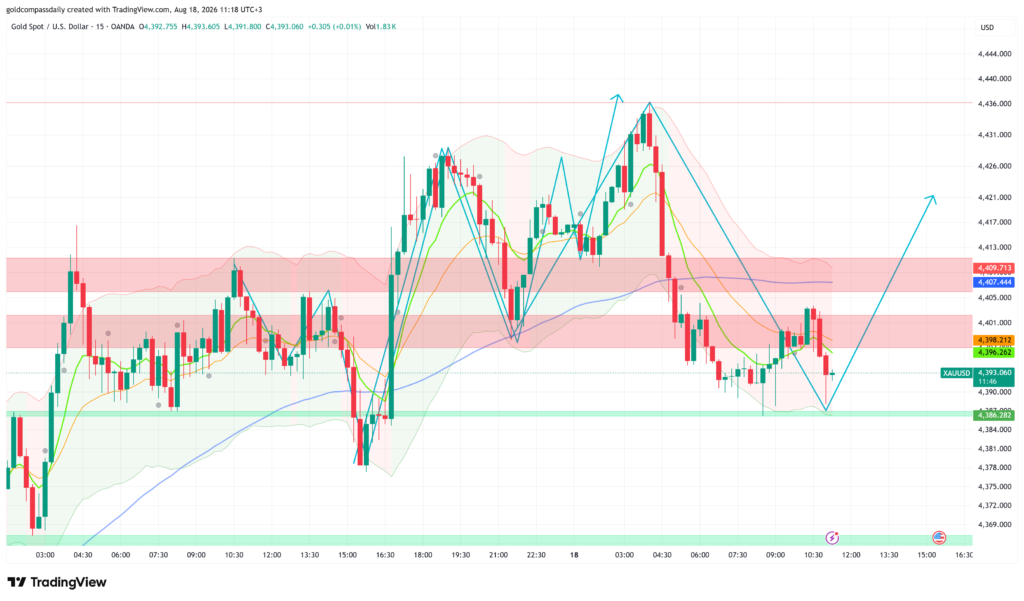
Gold Compass Daily’s morning analysis projected a potential flush toward $4,379–$4,387 before a recovery — price found its low at $4,386.28, holding the support zone precisely, and has since recovered to $4,393.06. The morning buy thesis remains intact.
What Changed
The $4,386 low printed during the London open shakeout, flushing early longs before buyers stepped in cleanly at the green demand zone. Price has since staged a two-leg recovery, reclaiming $4,393–$4,396 and now pressing against the lower edge of the pink resistance band. The projected path on the updated chart has shifted: the anticipated deeper wick to $4,379–$4,380 did not materialize — instead, $4,386.28 acted as the session low and the bounce has been orderly. European ZEW data (German ZEW at 26.3, below the 30.1 forecast; EU ZEW at 23.4 vs 25.9 expected) added mild safe-haven support to gold without generating a directional spike. The dollar has held a narrow range, providing no fresh headwind for the metal.
Updated Levels
- Current price: $4,393.06
- Bias now: Bullish — unchanged, $4,386 support confirmed
- Updated support: $4,386.28 → $4,380
- Updated resistance: $4,396.26 → $4,398.21 → $4,407.44
- London session target: $4,407.44 (conditional on NY open follow-through)
Scenarios into the NY Handoff
Bull: Price holds above $4,396.26 and clears $4,398.21 on a 15-minute close → targets $4,407.44 then $4,409.71 into the US data window at 3:30 PM UTC+3. Bear: Rejection at $4,398–$4,400 and a break back below $4,393 on volume → risks a retest of $4,386.28, with $4,380 as the next structural floor.
Chart Analysis
The updated 15-minute chart confirms the morning’s support thesis played out with precision: price wicked to $4,386.28 — the green demand zone base — before reversing sharply. The short-term MA (green) has crossed back above the medium MA (yellow/orange), a bullish cross that supports the recovery narrative. The longer-period blue MA continues to slope downward but price is now trading above it on the current candle, a tentative reclaim. The projected path drawn on the chart shows one more potential dip toward $4,386 before a sustained rally toward $4,421+, suggesting the structure remains in a higher-low sequence so long as $4,386 is not breached. The pink resistance band ($4,398–$4,410) is the immediate ceiling — a clean break and hold above $4,409.71 opens the door to $4,421 and beyond in the NY session. Volume remains low (1.83K on the current candle), indicating the move is not yet confirmed by conviction buying — watch for volume expansion on the approach to $4,398–$4,400.
New York Session Update
Price Check
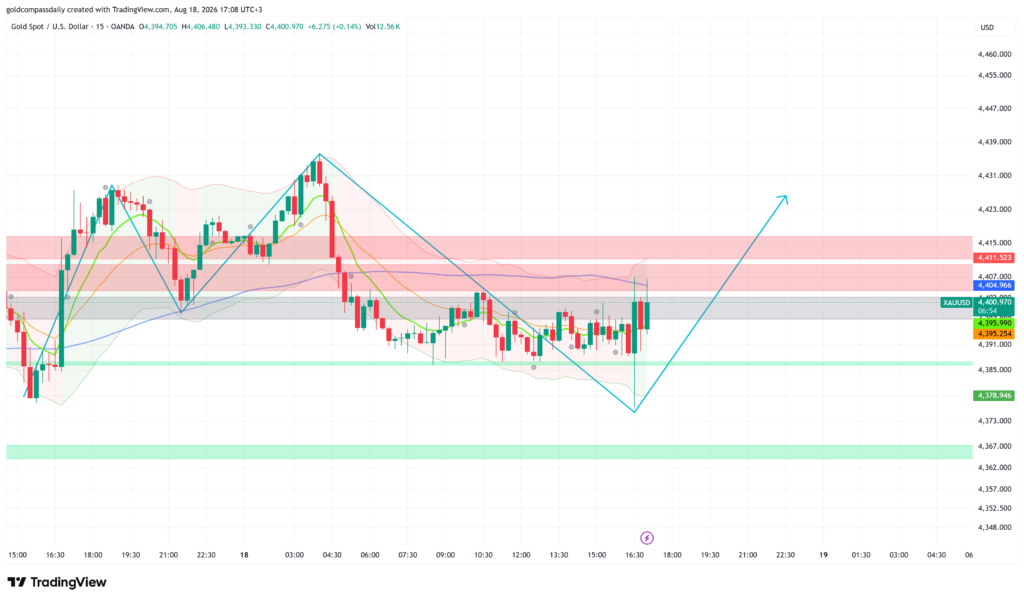
Gold Compass Daily’s morning analysis targeted $4,407.44 from the $4,386 support base — price has pushed to a session high of $4,406.48 before pulling back to $4,400.97, holding the buy thesis with the resistance cluster now directly overhead. The morning bias remains valid.
What Changed
The New York open delivered the data catalyst Gold Compass Daily flagged at 3:30 PM UTC+3: US Housing Starts came in at 1.34M against a prior of 1.43M, confirming the demand slowdown narrative, while Import Prices printed at 0.1% month-on-month — both readings consistent with a softening growth and inflation backdrop that reduces Fed tightening urgency. Industrial Production at 4:15 PM beat slightly at 0.3%, introducing a brief dollar bounce that capped gold’s push through $4,407 — but the reaction was short-lived. Price is now channeling between $4,395.25–$4,396 support and $4,404.97–$4,411.52 resistance, a well-defined compression structure ahead of the close. Volume expanded sharply into the NY open (12.56K on the current candle versus 1.83K mid-London), confirming institutional participation in the range.
Updated Levels
- Current price: $4,400.97
- Bias now: Bullish — unchanged, channel structure intact above $4,395
- Updated support: $4,395.25 → $4,378.95
- Updated resistance: $4,404.97 → $4,411.52 → $4,415.00
- NY session target: $4,411.52 on a clean break above $4,404.97
Scenarios into the Close
Bull: Price holds $4,395.25 and breaks $4,404.97 on a 15-minute close → targets $4,411.52, then the $4,415 pink resistance ceiling into the Asian handoff. Bear: Failure below $4,395.25 with a close under the channel base → projected flush to $4,378.95 demand zone before any recovery attempt.
Chart Analysis
The 15-minute chart has shifted to a wider timeframe view covering the full two-day structure, and the picture is constructive: price established a clear higher low at $4,378.95 (the green support level on the chart) and has recovered in a rising channel, posting a high of $4,406.48 before the current consolidation near $4,401. Moving averages are realigning bullishly — the green short-term MA has crossed above the yellow/orange medium MA, and both are beginning to slope upward while price trades above all three averages. The blue longer-period MA remains flat, acting as a dynamic support near $4,404.97. The projected path on the chart mirrors the morning update’s scenario: one more potential dip toward $4,378–$4,380 is marked as the alternative path, but the primary projection curves directly higher toward $4,421+ through the Asian session on August 19, consistent with the established bull thesis. The gray consolidation band ($4,395–$4,404) is the current battleground — a sustained close above it confirms the next leg up is underway.
New York Close & Asian Session Outlook
NY Close
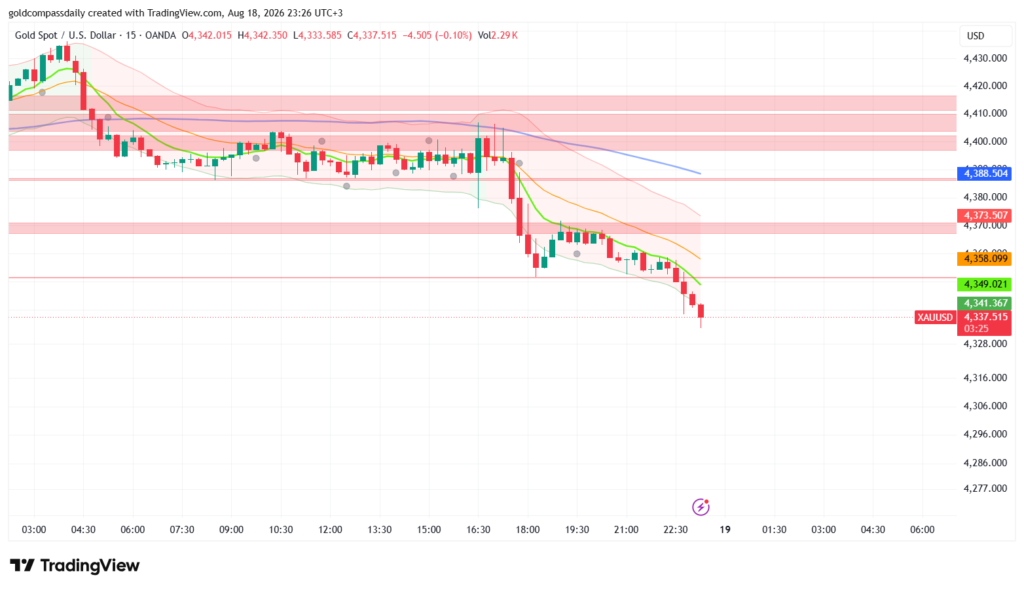
Gold closed the New York session at $4,337.52 — bearish — with the morning’s buy thesis fully invalidated after a sharp late-session breakdown that accelerated through every support level identified across the day’s three updates. The $4,395 channel base held through the NY open but collapsed decisively after 17:00 UTC+3, wiping the day’s recovery gains and closing well below the morning’s $4,380 invalidation level.
Updated Key Levels
- NY Close: $4,337.52
- Session high: $4,406.48 / Session low: $4,333.59
- Bias into Asian session: Bearish below $4,349.02
- Asian session support: $4,341.37 → $4,328.00
- Asian session resistance: $4,349.02 → $4,358.10 → $4,373.51
Chart Read at Close
The 15-minute chart presents an unambiguously bearish close structure. Price is trading well below all moving averages — the green short-term MA has crossed sharply below the yellow/orange medium MA, and both are declining steeply, while the long-period blue MA at $4,388.50 now acts as a distant ceiling. The Bollinger Bands have expanded aggressively to the downside with price pinned to the lower band, indicating sustained momentum selling rather than a temporary spike. The closing candle at 23:25 UTC+3 is a red body with minimal lower wick — sellers remain in full control with no sign of absorption at current levels. The visible chart shows no projected recovery path; the structure is a staircase of lower highs and lower lows from the $4,406 peak through the close at $4,337.
Asian Session Outlook
The Asian session is expected to open into a liquidity vacuum below the NY breakdown zone, with price likely to test the $4,341.37 level as the first structural reference. A brief consolidation or minor bounce toward $4,349.02 is probable early in the session as thin liquidity allows for a partial recovery attempt — but any retest of $4,358.10 or above would constitute a technical relief rally within a bearish structure, not a reversal. The more probable path is a continuation grind toward $4,328 if $4,341 fails to hold on the first test. London open will determine whether the breakdown extends or a meaningful base forms.
Next Day Bull / Bear Scenarios
Bull trigger: Reclaim and 15-minute close above $4,358.10 with rising volume → targets $4,373.51, then $4,388.50 as the first meaningful recovery zone. Bear trigger: Failure to hold $4,341.37 and a close below $4,333.59 (session low) → opens $4,316–$4,320 as the next downside target with no structural support between.
Tomorrow’s Key Events
- Wednesday, time TBC UTC+3 — FOMC Minutes: Primary event risk for the week; any language reinforcing higher-for-longer rates would extend today’s selloff; dovish tone needed to reverse the breakdown.
- Wednesday, 3:30 PM UTC+3 — US Jobless Claims (if scheduled): Labor market resilience would reinforce dollar strength and compound gold’s downside.
- Wednesday, ongoing — DXY and US real yields: The primary mechanical drivers behind today’s drop; continued dollar strength above key levels keeps gold under pressure.
Analysis based on the XAU/USD 15-minute chart as of August 18, 2026, 08:43 UTC+3. This article is for informational and educational purposes only and does not constitute financial advice.